
Figure 8. Association of IL-1 pathway gene expression with survival of HNSCC patients.
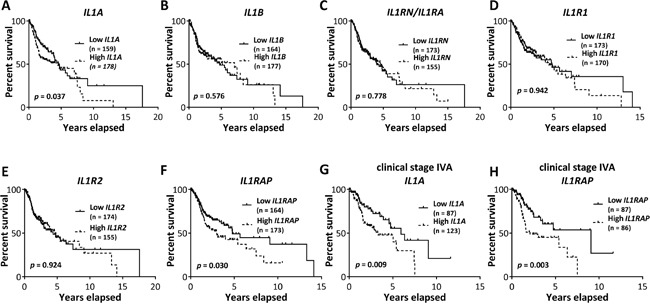
Kaplan-Meier survival curves were generated from Pancan normalized HNSCC gene expression data from The Cancer Genome Atlas data portal for HNSCC patients of all clinical stages, sorted into highest and lowest tertile cohorts based on tumor IL1A A., IL1B B., IL1RN C., IL1R1 D., IL1R2 E. and IL1RAP F. mRNA expression. Kaplan-Meier survival curves generated from stage IVA HNSCC patients, sorted into highest and lowest tertiles based on tumor IL1A G. and IL1RAP H. mRNA expression. Number of subjects in each cohort was indicated in parentheses in respective plots.