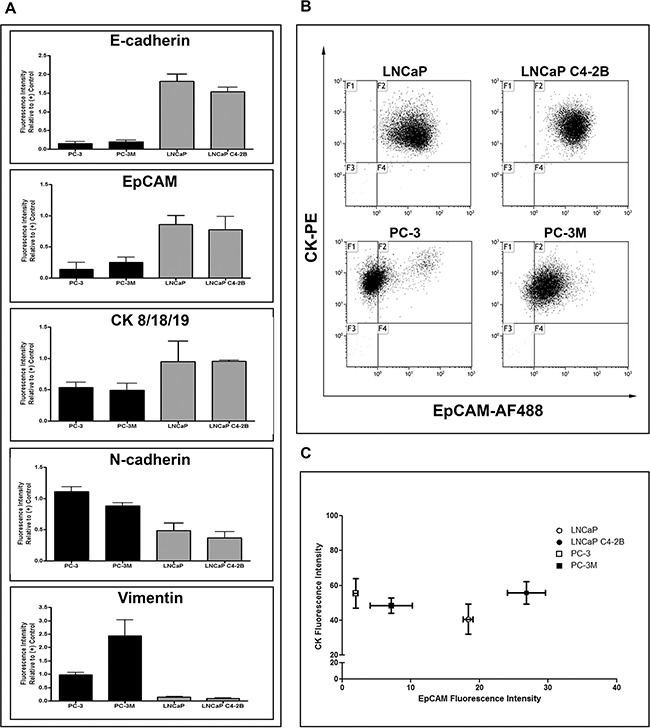
Figure 1. Human prostate cancer cell lines display differences in EMT phenotype.

A. Protein expression analysis by flow cytometry for the epithelial-associated markers E-cadherin and EpCAM and the mesenchymal-associated markers N-cadherin and vimentin in PC-3M, PC-3, LNCaP C4-2B, and LNCaP human prostate cancer cells. Data are presented as relative fluorescence intensity (expression) compared to appropriate positive control cell lines (E-cadherin/EpCAM/CK: MDA-MB-468; N-cadherin/vimentin: HeLa) (n=3). The expression of epithelial-associated and mesenchymal-associated proteins corresponds to previously reported cell aggressiveness and in vivo metastatic capacity of these cell lines. B. Flow cytometry dot plots of the differential expression of EpCAM (AF488) and CK8/18/19 (PE) in investigated prostate cancer cell lines. C. Flow cytometry analysis for co-expression of EpCAM and CK8/18/19, presented as the mean ± SEM fluorescence intensity of the investigated proteins for each cell line (n=3).
