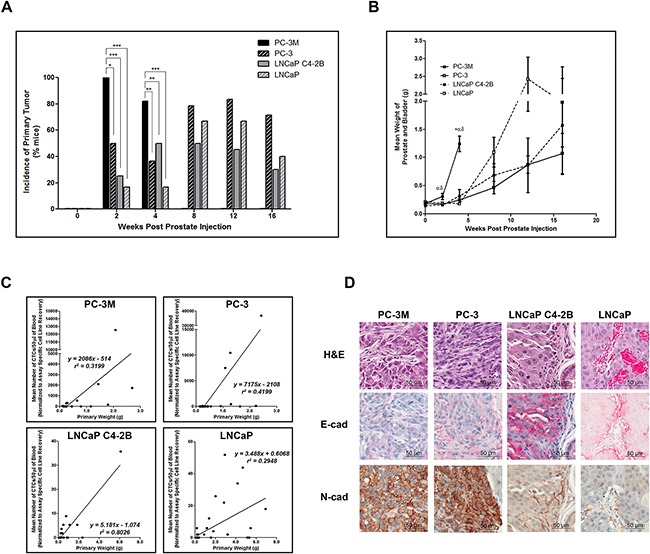
Figure 3. Highly mesenchymal prostate cancer cells exhibit enhanced primary tumor incidence and size and in all cell lines CTC number is correlated with primary tumor size.

A. Incidence of primary tumor formation following orthotopic injection of PC-3M, PC-3, LNCaP C4-2B, and LNCaP human prostate cancer cell lines. Data are presented as the percentage of mice per cell line per timepoint with detectable primary tumors (n=6-39 mice/group) as assessed by microscopic histological examination of formalin-fixed, H&E stained tissue. * = significantly different (p<0.05), ** (p<0.01), *** (p<0.001). B. Mean combined weight of prostate and bladder at time of sacrifice following orthotopic injection of prostate cancer cell lines. Data are presented as the mean ± SEM (n=6-39 mice/group). C. Mean normalized number of CTCs/50μl of blood (assessed using the EMT semi-independent assay) correlates with the primary tumor weight in all cell lines. D. Representative H&E and IHC (E-cadherin and N-cadherin) images of primary prostate tumors for each cell line (40x; scale bars = 50 μm). Primary tumor weights were assessed for cell line variances using Levene's test, followed by a 1-way ANOVA with Tukey's post-test for multiple comparisons. Spearman rank correlation was utilized to examine the relationship between mean number of CTCs and primary tumor weight. * = significant difference relative to PC-3; α = significant difference relative to LNCaP C4-2B; δ = significant difference relative to LNCaP (p≤0.05).
