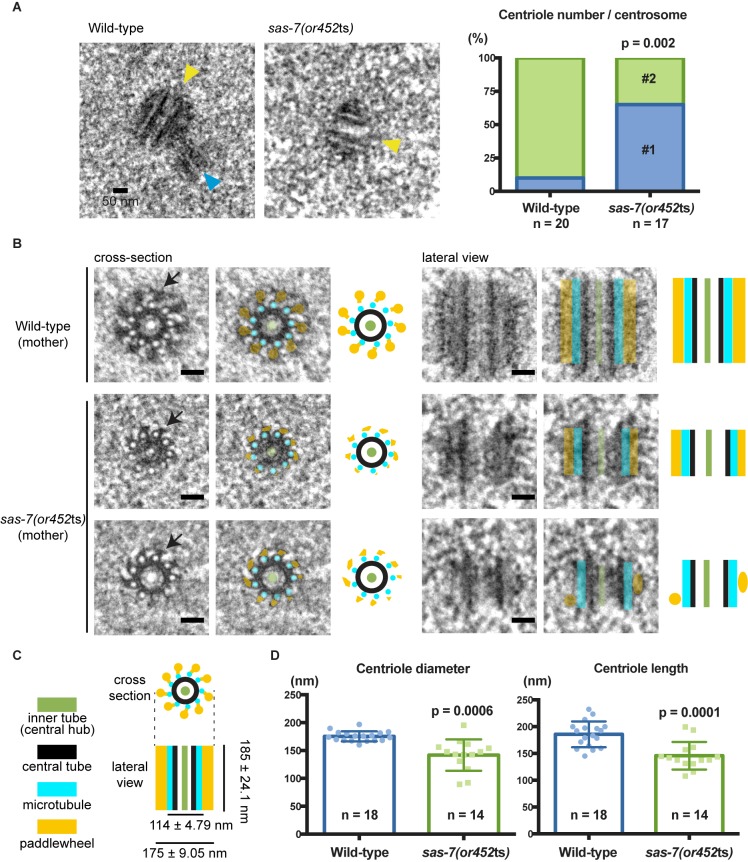
Figure 4. SAS-7 is required for centriole duplication, assembly and elongation.
(A) TEM images of centrioles. Yellow and blue arrowheads indicate the mother and daughter centrioles, respectively. P-value in the graph was calculated by the Fisher's exact test. (B) Cross-section and lateral view TEM images of centrioles. Arrows indicate the paddlewheel structure. Colored overlays indicate the distinct structural units shown in C. (C) Schematic representations of C. elegans centriole structure and chirality when viewed from the distal end. (D) Quantified centriole diameter and length. Mean ± SD shown. P-values calculated by the Welch's t-test. See also Figure 4—figure supplement 1. Scale bars indicate 50 nm.


