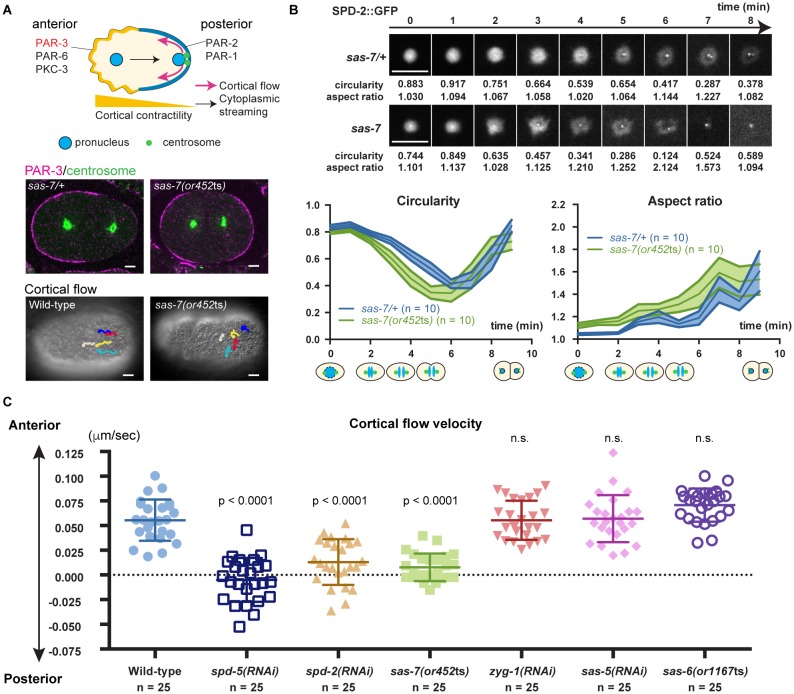
Figure 7. SAS-7 regulates PCM function and integrity.
(A) Top: Schematic illustration of PAR-dependent cell polarity at 1 cell stage. Middle: PAR-3 and SPD-5 antibody staining at telophase. Cortical PAR-3 and centrosomal SPD-5 are shown in magenta and green, respectively. Bottom: Trajectories of surface yolk granule movements during 120 s in early prophase. (B) PCM shapes in sas-7 mutant. Using SPD-2::GFP, PCM circularity and aspect ratios of anterior centrosomes were calculated and shown in the graphs. Time is relative to NEBD. sas-7 heterozygous siblings were used for control. (C) Cortical flow velocities in control and mutant embryos. Cortical flows were calculated and anterior-directed movements given a positive value. Mean ± SD are shown. P-values were calculated by one-way ANOVA with Bonferroni's multiple comparison test. Scale bars indicate 5 µm.

