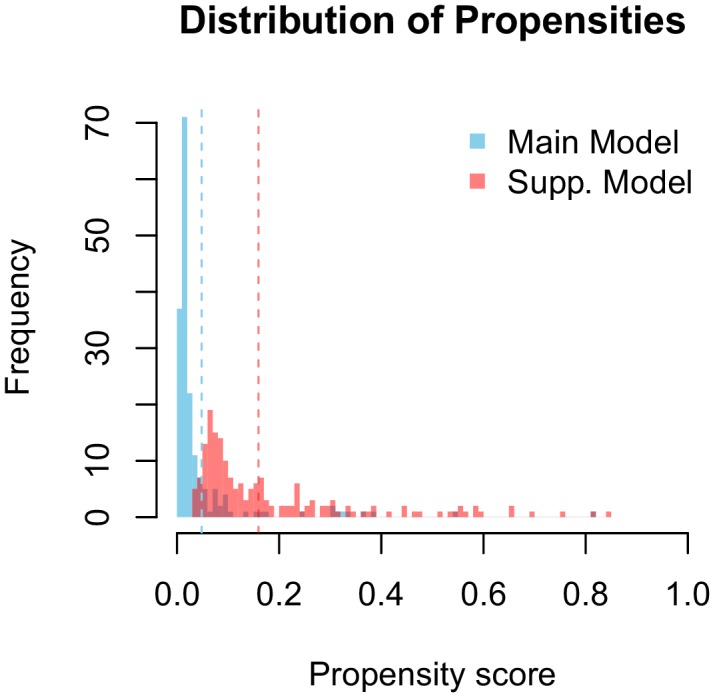
Appendix 1—figure 2. Distribution of propensity values for the main and supplementary models.

Dashed lines represent corresponding threshold values for each model based on lowest ranked known vector propensities.

Dashed lines represent corresponding threshold values for each model based on lowest ranked known vector propensities.