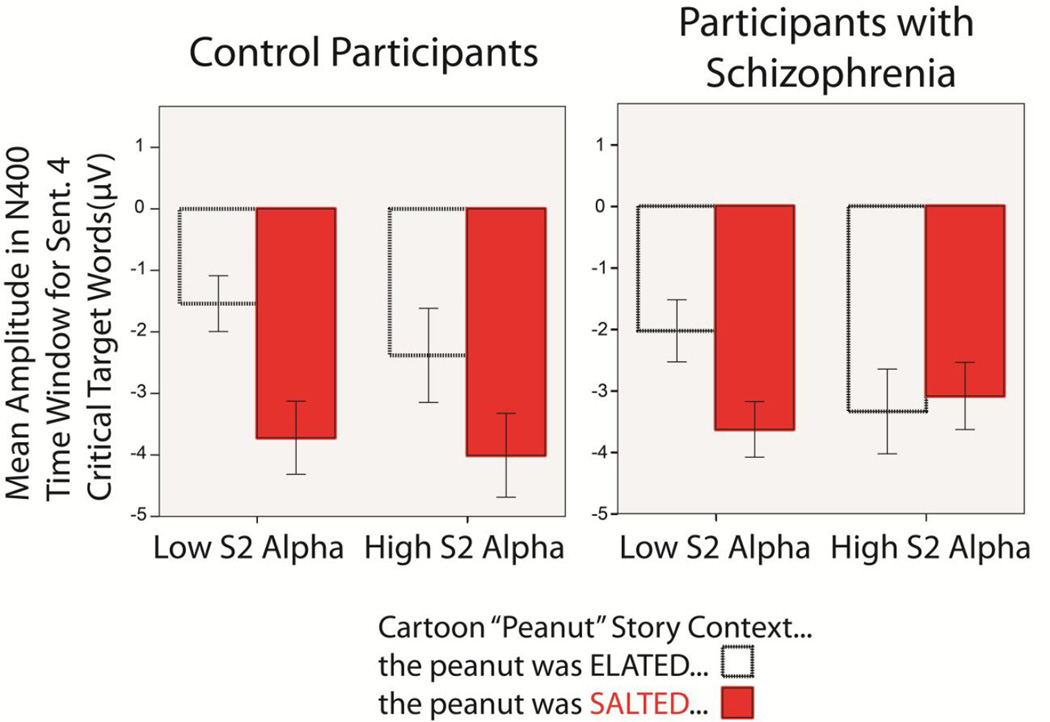
Fig 5.
Displayed is mean amplitude in the N400 time window following critical target words in Sentence 4, as a function of condition (Animate, Inanimate) and alpha power level measured during Sentence 2 of each trial (High, Low). On the Y-axis is mean N400 amplitude for sentence 4 critical target words; note that larger negative values denote larger effect sizes due to the negative-going nature of the N400 waveform. On the X-axis is Sentence 2 alpha level. Results for control participants are plotted on the left, and results for participants with schizophrenia are plotted on the right. Animate critical target words are displayed with dotted/open bars and Inanimate critical target words are displayed with solid/gray bars.

