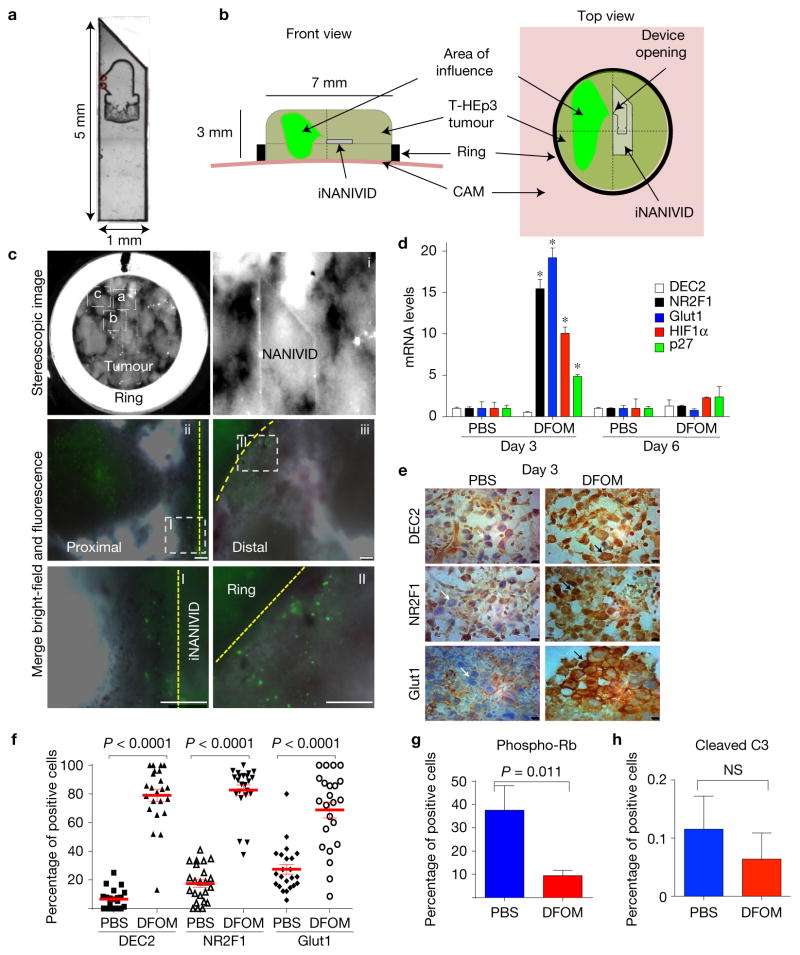
Figure 2.
Hypoxia induction using iNANIVID. (a) Magnified image (×10) of an iNANIVID. (b) Illustration depicting the iNANIVID in a tumour on the chicken CAM. The tumour is contained in a Teflon ring for support. The device opening is in the upper left quadrant. The area of influence is shown in green. (c) A three-day-old Tet-On H2B-GFP T-HEp3 tumour with an implanted iNANIVID (10 mM doxycycline or PBS (see Supplementary Fig. 1F)). First panel (top row, left): stereoscopic image of the tumour in situ (×4). Boxes i, ii and iii indicate the areas of the following images. i: tip and opening of the iNANIVID in situ. ii: merged image of a tumour area proximal to the iNANIVID showing GFP-positive cells. The dashed line indicates the Teflon ring. iii: merged image of a tumour area distal to the iNANIVID showing GFP-positive cells. The dashed line indicates the iNANIVID. Boxes I+II: details of the proximal (I) and distal (II) tumour areas. Scale bars, 250 μm; n = 3 tumours were assessed; representative images are shown. See also Supplementary Figs 1F and 2A–D for the DFOM diffusion gradient. (d) Relative mRNA expression levels in T-HEp3 CAM tumours treated in vivo for 3 or 6 days with Hi-NANIVID or PBS-iNANIVID. GAPDH was used as a housekeeping gene. n= 3 tumours per group, PCR in triplicate, mean + s.e.m.; *P < 0.001, two-tailed Student’s t-test. (e) IHC staining for DEC2, NR2F1 and GLUT1 in 3-day-old PBS- or Hi-NANIVID (DFOM) T-HEp3 CAM tumours. White arrows, negative; black arrows, positive cells. Scale bars, 10 μm; n= 3 tumours were assessed; representative images are shown. (f) Quantification of IHC staining for DEC2, NR2F1 and GLUT1 in 3-day-old PBS- or Hi-NANIVID T-HEp3 CAM tumours. Horizontal bars indicate median ± s.e.m., n = 23 HPFs pooled from 3 tumours; Mann–Whitney test. See Supplementary Fig. 2E,H for day 6. (g,h) Quantification of IF staining for phospho-Rb and cleaved caspase-3 of T-HEp3 CAM tumours treated for 3 days with PBS- or Hi-NANIVID. Mean + s.d.; n = 500 cells pooled from 3 tumours; two-tailed Student’s t-test. See Supplementary Fig. 2I for staining.

