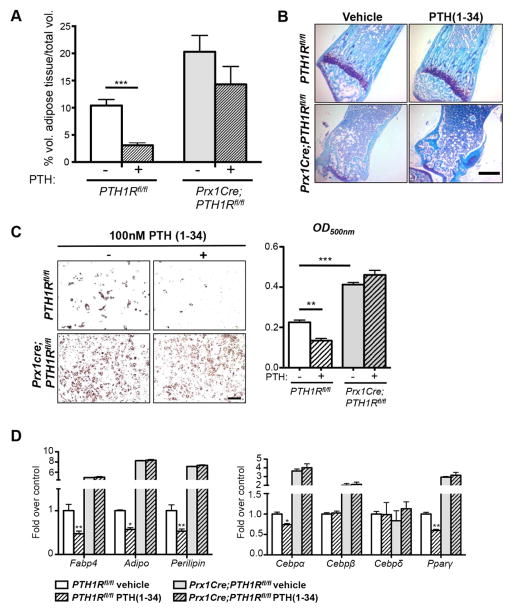
Figure 3. Control of BMAT formation by PTH in vivo and in vitro.
(A) OsO4 μCT analyses of 3-wk- old tibiae of PTH1Rfl/fl and Prx1Cre;PTH1Rfl/fl under vehicle or PTH(1-34) administration. Control mice showed marked reduction in volume of adipose tissue/total volume, whereas Prx1Cre;PTH1Rfl/fl mice exhibited higher basal BMAT levels, which were not significantly affected by PTH administration. ***p<0.001 versus PTH1Rfl/fl under vehicle treatment. Two-way ANOVA and Bonferroni posttests were used to evaluate individual samples responses related to PTH(1-34) treatment. Genotype effect: ##p=0.0014, PTH(1-34) effect: $p=0.0264. (B) Toluidine blue stained paraffin sections of tibiae of PTH1Rfl/fl and Prx1Cre;PTH1Rfl/fl under vehicle or PTH(1-34) administration n=6. Scale bar: 500μm. (C) Oil red O staining and quantification of PTH1Rfl/fl and Prx1Cre;PTH1Rfl/fl BMSC cultures under adipogenic condition, treated with vehicle or 100 nM PTH(1-34). PTH treatment reduced oil red O staining in PTH1Rfl/fl BMSCs. In contrast, Prx1Cre;PTH1Rfl/fl cells showed higher numbers of adipocytes at basal stage and did not respond to PTH(1-34). n=3. Scale bar: 200μm. (D) qRT-PCR analyses of adipocyte specific genes in BMSCs under adipogenic condition, with vehicle or PTH(1-34) treatment. PTH1Rfl/fl BMSCs showed significantly reduced adipogenic markers (Fabp4, Adiponectin, Perilipin, Cebpα and Pparγ) after PTH administration whereas Prx1Cre;PTH1Rfl/fl BMSCs did not respond to PTH(1-34). n=3. *p<0.05, **p<0.01, ***p<0.001 versus PTH1Rfl/fl under vehicle treatment. All graphs show mean ± SEM. See also Figure S3.

