
Figure 4.
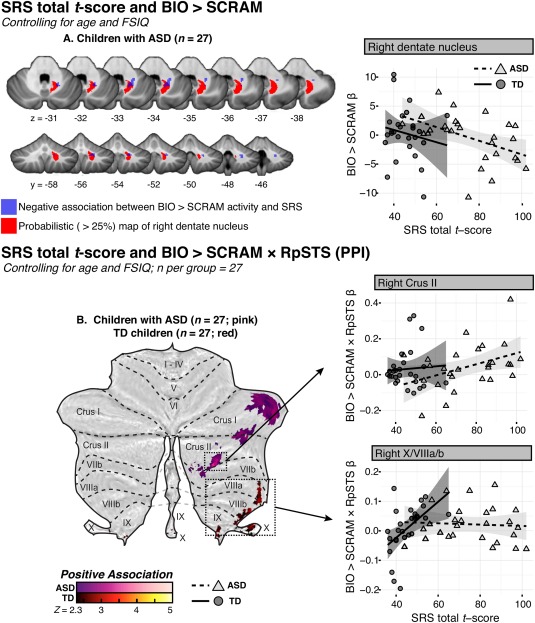
(A) Z‐statistic display of the region that demonstrated a negative association between Social Responsiveness Scale (SRS) total t‐score and response to the BIO > SCRAM contrast among children with ASD (blue), overlaid onto the SUIT template, with the SUIT probabilistic map of the right dentate nucleus, thresholded at >25%, indicated in red. Weighted β‐values for the BIO > SCRAM contrast were extracted from this region and plotted against SRS total t‐score, with fit lines and 95% confidence intervals estimated separately for each group within the matched child sample. (B) Flattened z‐‐statistic display of regions that demonstrated a significant association between SRS total t‐score and the BIO > SCRAM × RpSTS psychophysiological interaction (PPI), within the matched sample of TD children and children with ASD. Weighted β‐values for the PPI regressor were extracted from selected regions (boxed) and plotted against SRS total t‐score. Higher SRS total t‐scores indicate greater social impairment. [Color figure can be viewed at http://wileyonlinelibrary.com]