
Figure 5.
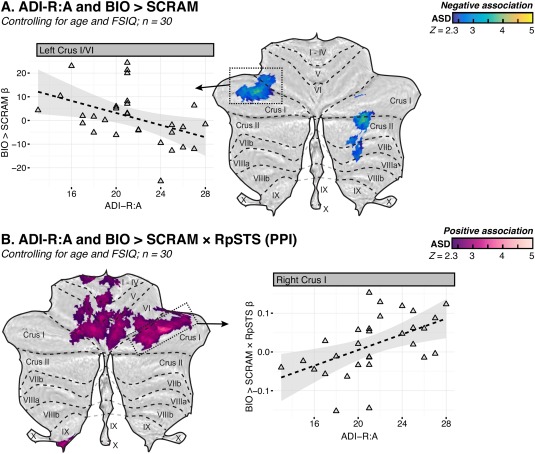
Flattened z‐statistic displays of regions that demonstrated associations between diagnostic algorithm A of the Autism Diagnostic Interview‐Revised (ADI‐R), “Qualitative Abnormalities in Reciprocal Social Interaction” and (A) the BIO > SCRAM contrast or (B) the psychophysiological interaction (PPI) between BIO > SCRAM and a seed in right posterior superior temporal sulcus (RpSTS). Weighted β‐values for the relevant contrast were extracted from selected regions (boxed) and plotted against ADI‐R:A score. Higher ADI‐R:A scores indicate greater social impairment. [Color figure can be viewed at http://wileyonlinelibrary.com]