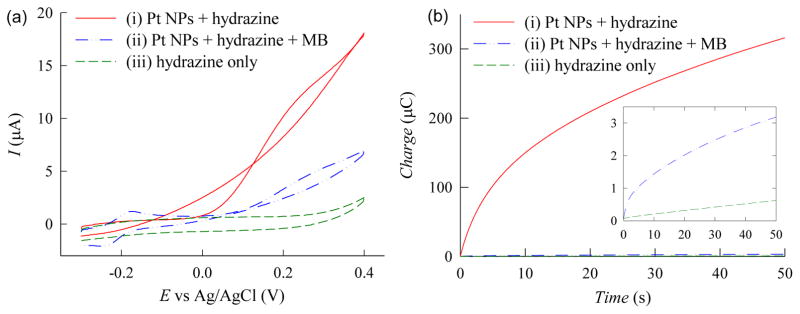
Fig. 3.
(a) Cyclic voltammograms of PBS solutions containing (i) 5 mM hydrazine and 0.001% (w/v) Pt NPs, (ii) 5 mM hydrazine, 0.001% (w/v) Pt NPs, and 10 μM MB, and (iii) 5 mM hydrazine only. Voltammograms are recorded at a scan rate of 50 mV/s using unmodified ITO electrodes. (b) Chronocoulograms of PBS solutions containing (i) 5 mM hydrazine and 0.001% (w/v) Pt NPs, (ii) 5 mM hydrazine, 0.001% (w/v) Pt NPs, and 10 μM MB, and (iii) 5 mM hydrazine only. Inset shows magnified view of the chronocoulograms for curves ii and iii. Chronocoulograms are recorded at 0.05 V using unmodified ITO electrodes.

