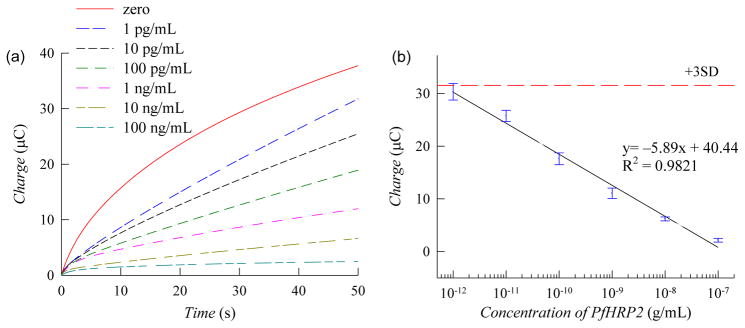
Fig. 4.
(a) Chronocoulograms of PBS spiked with PfHRP2 recorded at 0.05 V (vs Ag/AgCl). (b) Calibration plot based on chronocoulometric charges at 50 sec from the response profile in panel a. Each data point represents the mean ± SD of three separate measurements using new electrodes. The dashed line corresponds to 3× the charge SD at zero concentration.

