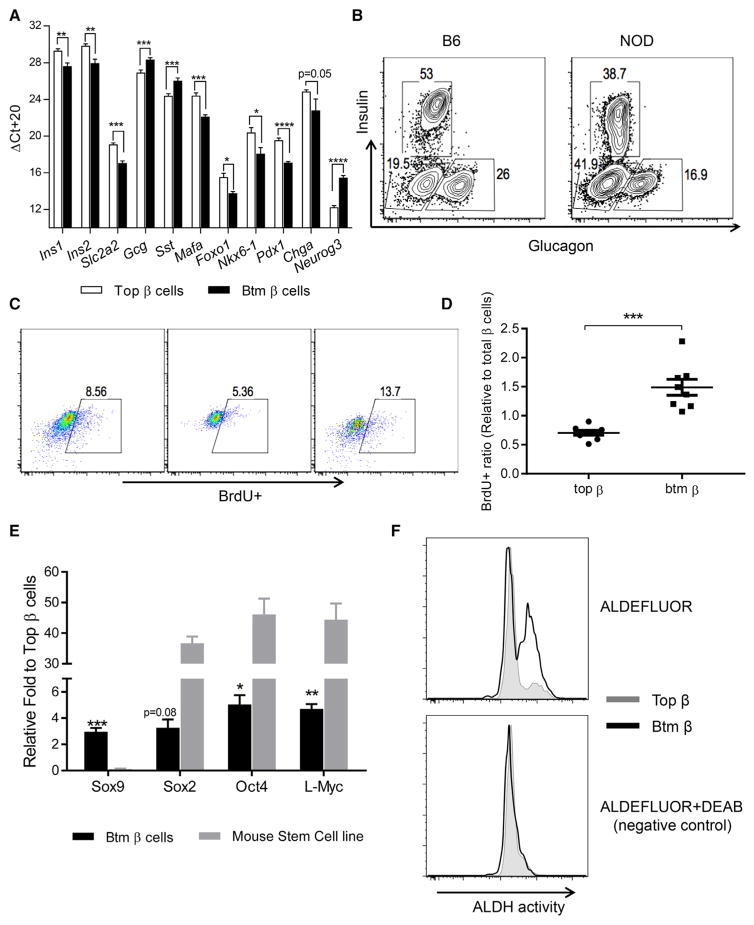
Figure 4. Transcription Profiles of the Two β Cell Subpopulations by Real-Time qPCR.
(A) Top and Btm β cells were sorted from 8- to 10-week-old NOD mice. RNA was recovered, and the transcription levels of the β cell genes shown were measured by real-time qPCR. The Ct values were normalized to Actb mRNA levels (ΔCt = Ct of Actb-Ct of target gene + 20). Data represent mean ± SEM of three experiments, each with pools of four to six mice. Student’s t tests were performed with an FDR of 5% (*p < 0.05, **p < 0.01, ***p < 0.001, ****p < 0.0001).
(B) FACS analysis of insulin and glucagon expression in islet cells pooled from 10-week-old NOD and B6 mice (numbers refer to the percent of the cells gated on CD45− cells). Data are from a single experiment representative of three experiments.
(C) Eight-week-old NOD mice were given bromodeoxyuridine (BrdU) in drinking water for 9 days, followed by normal water for another week before sacrifice. The incorporation of BrdU was studied in unsorted or sorted Top and Btm β cells. The number refers to the percentage of BrdU+ cells of total β cells. Data are from pooled cells from two or three mice per experiment and are representative of three independent experiments.
(D) Data points represent pools of two or three mice from three experiments. Values represent mean ± SEM (***p = 0.0002, Mann-Whitney test).
(E) The transcription levels of Sox9 and the stem cell factors Sox2, Oct4, and L-Myc were studied by real-time qPCR in Top and Btm β cells from 8- to 10-week-old NOD mice. RNA input was normalized to Actb. Data represent mean ± SEM of three experiments, with β cells sorted from four to six mice. Btm and Top cells from the same isolation were compared using a single-sample t test to a mean of 1 (n = 4; *p < 0.05, **p < 0.01, and ***p < 0.001). Comparisons were also made between the stem cell line SCRC-1002 and Top β cells (p < 0.0001, two-way ANOVA).
(F) Top and Btm β cells were sorted from 8- to 10-week-old NOD mice, and ALDH activity was measured by FACS and compared between Top and Btm β cells. One paired sample from three independent experiments is shown (n = 6–8 mice per experiment). ALDH, aldehyde dehydrogenase. DEAB is an inhibitor of ALDH.

