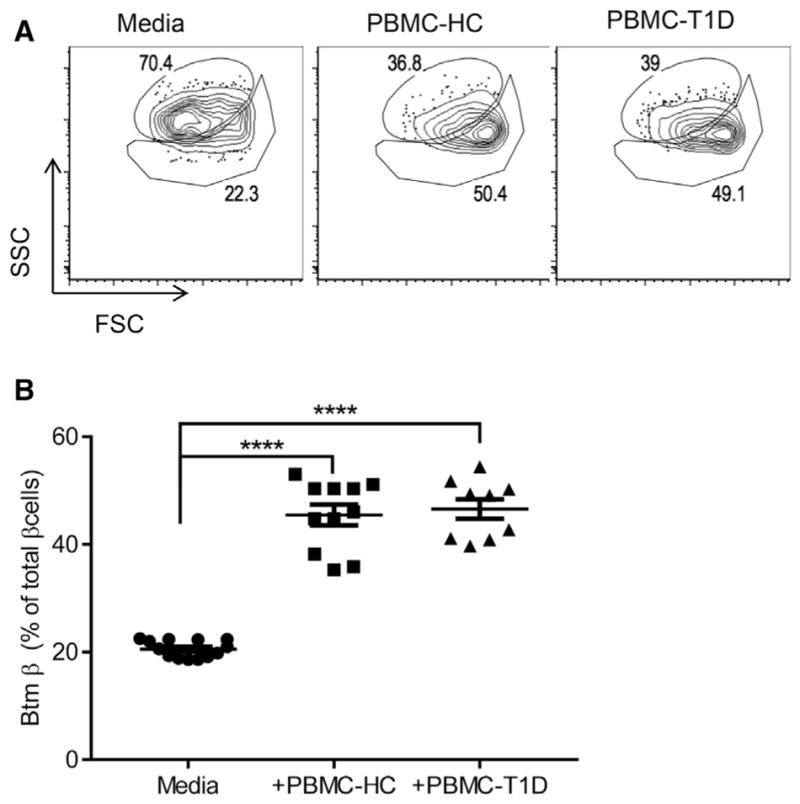
Figure 6. Changes in Human β Cells in Culture with Allogeneic Lymphoid Cells from Patients with T1D.

PBMCs from patients with T1D or healthy control subjects (HC) were cultured with human islets for 4 days. Single β cell composition was analyzed by FACS after staining with FluoZin and TMRE. Representative data showing SSC/FSC from one of four experiments are shown. The numbers indicate the percentage of Top and Btm β cells (A). (B) The percentage of Btm β cells from each well from four independent experiments was calculated and compared. Each data point represents a pool of islet cells from four separate experiments (mean ± SEM; ****p = 0.0001, Dunnett’s multiple comparison test).
