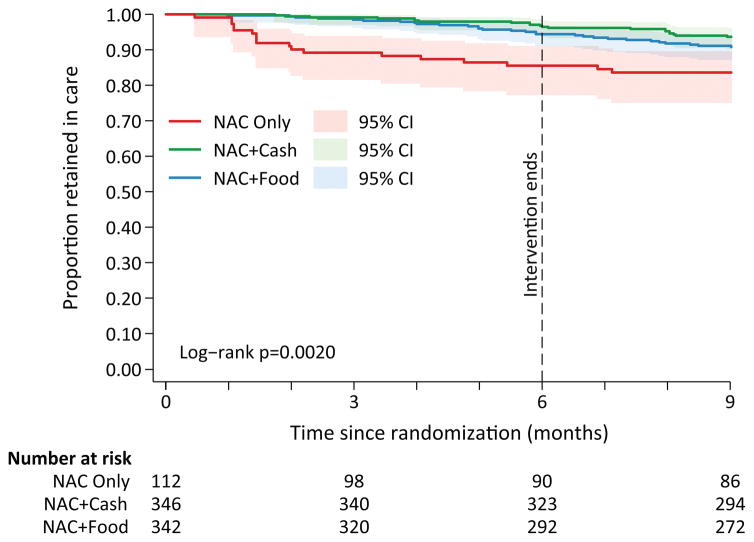
FIGURE 3.
Kaplan-Meier curves of the percent of participants in care over time, stratified by study arm (nutrition assessment and counseling (NAC) plus cash or food transfers)a,b
a. Log-rank test for equality of the survival functions: p<0.01
b. The proportion of participants retained in care was defined as one minus the probability of LTFU (≥3 months since the last scheduled visit). By definition, follow-up time between 9 and 12 months could not be classified as LTFU and is therefore not included on the graph.

