
Figure 1. Negative stain EM analysis shows that Pom152 has an extended, string-of-pearls shaped luminal domain.
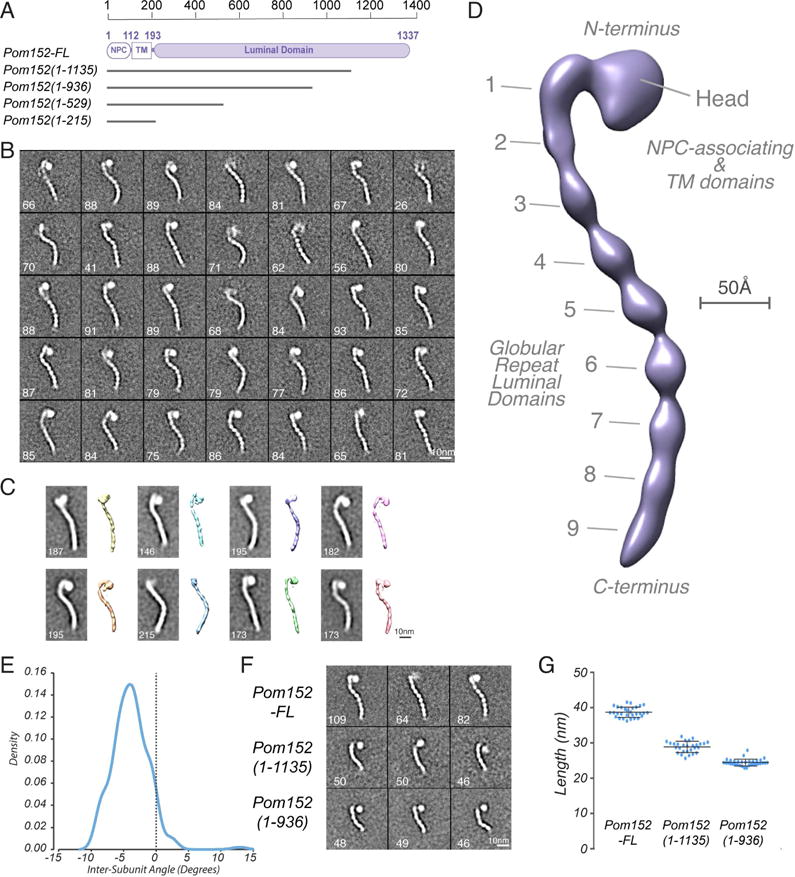
(A) Domain organization of Pom152FL and four truncations drawn to scale. Pom152FL exhibits a three-domain organization with the domain inside the NPC (NPC), the transmembrane segment (TM), and the domain inside the nuclear envelope lumen (luminal domain). The numbers indicate amino acid residue positions. Horizontal grey lines for the truncations represent the number of amino acid residues in each segment.
(B) 35 representative negative-stain EM class averages of Pom152FL. The number of particles in each class is shown. Bar, 10 nm.
(C) Representative random conical tilt 3D maps (right) are aligned to each of the corresponding class averages (left). The number of particles in each class is shown. Bars, 10 nm.
(D) Negative-stain EM density map of Pom152FL. The nine globular domains in C-terminal lumen (1 to 9) and the N-terminal head region containing the NPC-associating and TM domains are indicated. Bar, 50 Å.
(E) The average inter-domain angle for the last 7 repetitive regions was estimated in 37 representative Pom152FL class averages using the ImageJ angle tool. One angle was measured between domains 3 and 9, its difference from 180° was determined and the resulting value divided between the seven globular domains involved in the estimation. Distribution of the resulting inter-domain angles is shown in a Kernel density plot with a peak of −4.1° indicating a small negative curvature for the particles.
(F) Representative negative-stain EM class averages of three assigned views of Pom152FL, Pom1521–1135, and Pom1521–936. The number of particles in each class is shown. Bar, 10 nm.
(G) End-to-end distances of Pom152FL, Pom1521–1135, and Pom1521–936 in samples of 30, 28, and 33 class averages, respectively. The lines on the data points indicate the mean and SD: 38.7 ±1.5 nm, 28.9 ±1.6 nm and 24.4 ±1.0 nm for the samples, respectively.