
Figure 1.
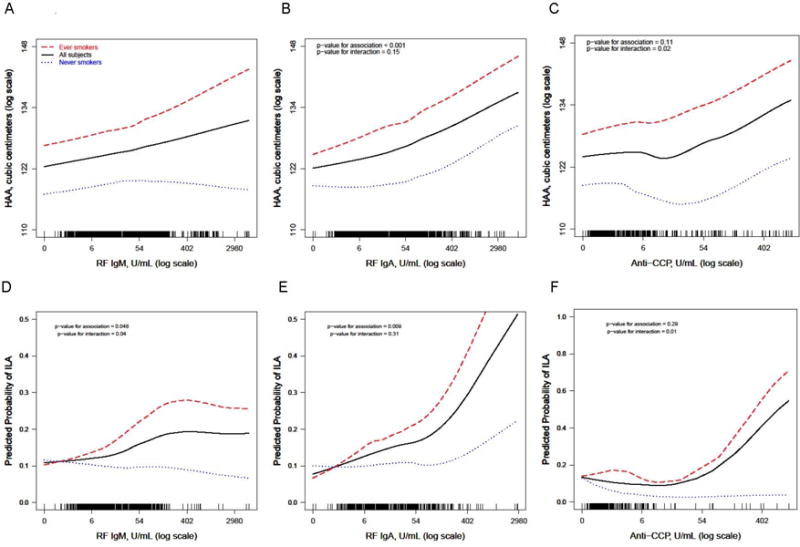
Continuous relationships of RF IgM (A and D), RF IgA (B and E), and CCP (C and F) with predicted (adjusted) high attenuation area volume (A, B, C) and the predicted probability of interstitial lung abnormalities (D, E, F). A, B, and C: Smoothed regression lines (solid line: all subjects, dashed line: ever smokers, dotted line: never smokers) are adjusted for age, sex, race, study site, BMI, total volume of imaged lung, percent emphysema, and tube current. The solid line is also adjusted for pack-years of smoking and current smoking status. D, E, F: Smoothed regression lines (solid line: all subjects, dashed line: ever smokers, dotted line: never smokers) are adjusted for age, sex, and race. The solid line is also adjusted for pack-years of smoking and current smoking status. Each vertical tick mark on the rug plot running along the internal border of the x-axis represents one study participant. P-values shown are for the multivariable-adjusted associations between each autoantibody and HAA or ILA in the overall cohort and for interactions between each autoantibody and ever smoking status.