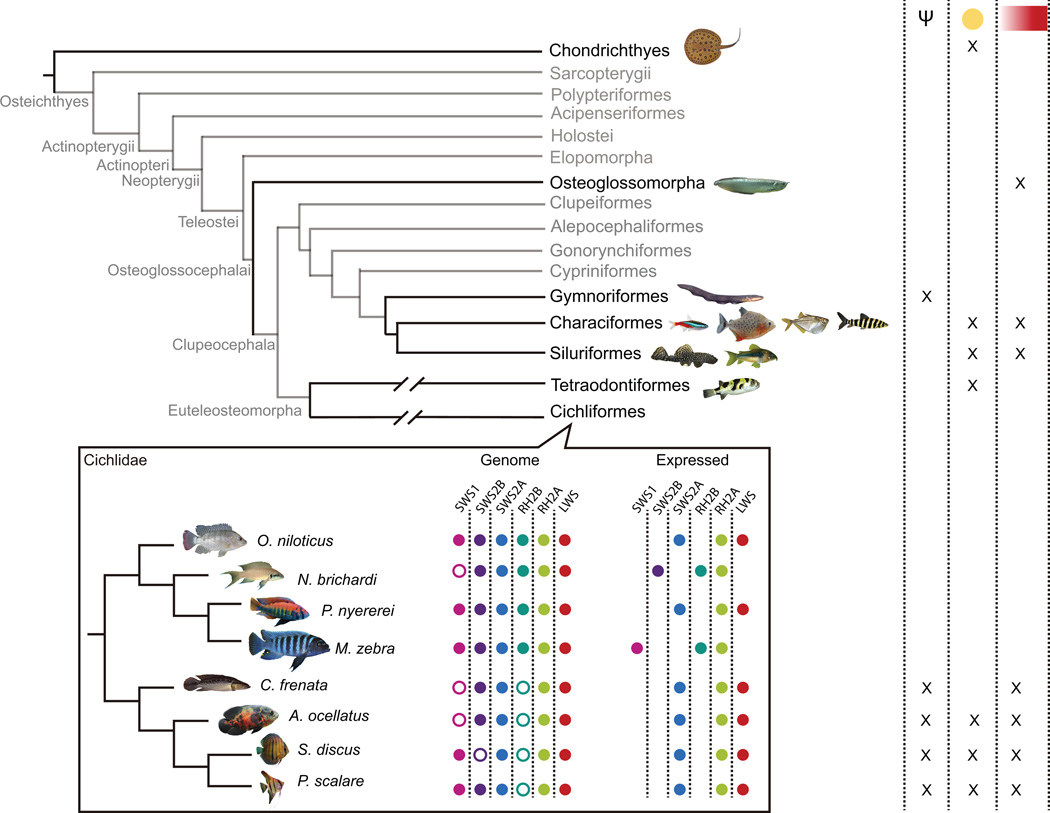
Figure 5.
Schematic representation of visual system adaptation in a phylogenetic context. Phylogenetic tree topology is based on Betancur et al (2013). Taxonomic groups present in the Amazon where visual systems have been analyzed at some level are displayed in black. Based on previous and the present study, an “x” denotes the presence of pseudogenes or lost genes (Ψ), yellow pigments in ocular media (yellow circle), or long wavelength spectral sensitivities, either by opsin expression or MSP, (red rectangle) in a specific group. The cichlid inset denotes the opsin genes in the genome and the ones that are being expressed in the Neotropical and African lineages. Empty circles denote pseudogenes or lost genes. For simplicity, RH2A duplicates were excluded.

