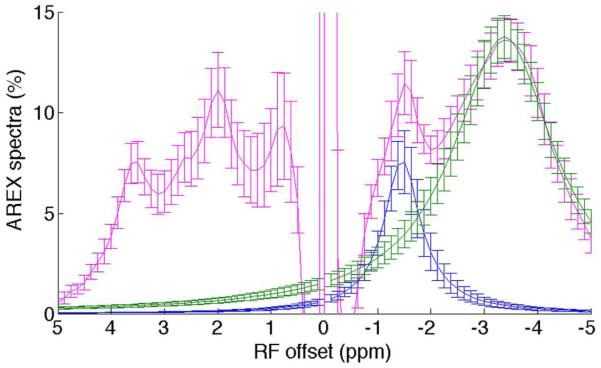
Fig. 2.
AREX residual spectra (magenta), fitted NOE(−1.6) peak (blue), and fitted NOE(−3.5) peak (green) from nine healthy rat brains. Note that the NOE(−1.6) peak can be isolated from the NOE(−3.5) peak by using Lorentzian fit. Regions of interest (ROIs) were drawn from the whole brain. Error bars are the standard deviations across subjects.

