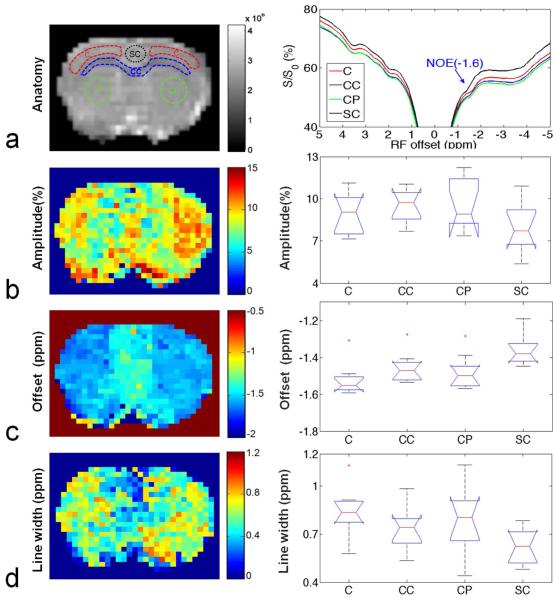
Fig. 3.
Left column: anatomic image to show the four ROI (C: Cortex; CC: Corpus Callosum; CP: Caudate Putamen; SC: Singular Cortex) (a) and pixel-by-pixel fitted maps for amplitude (b), resonance frequency offset (c), and line width (d) of the NOE(−1.6) signal from a healthy rat brain. Right column: averaged Z-spectra from the four ROIs (a) and the statistical analysis of amplitude (b), resonance frequency offset (c), and line width (d) of the NOE(−1.6) signal from nine healthy rat brains. (n=9)

