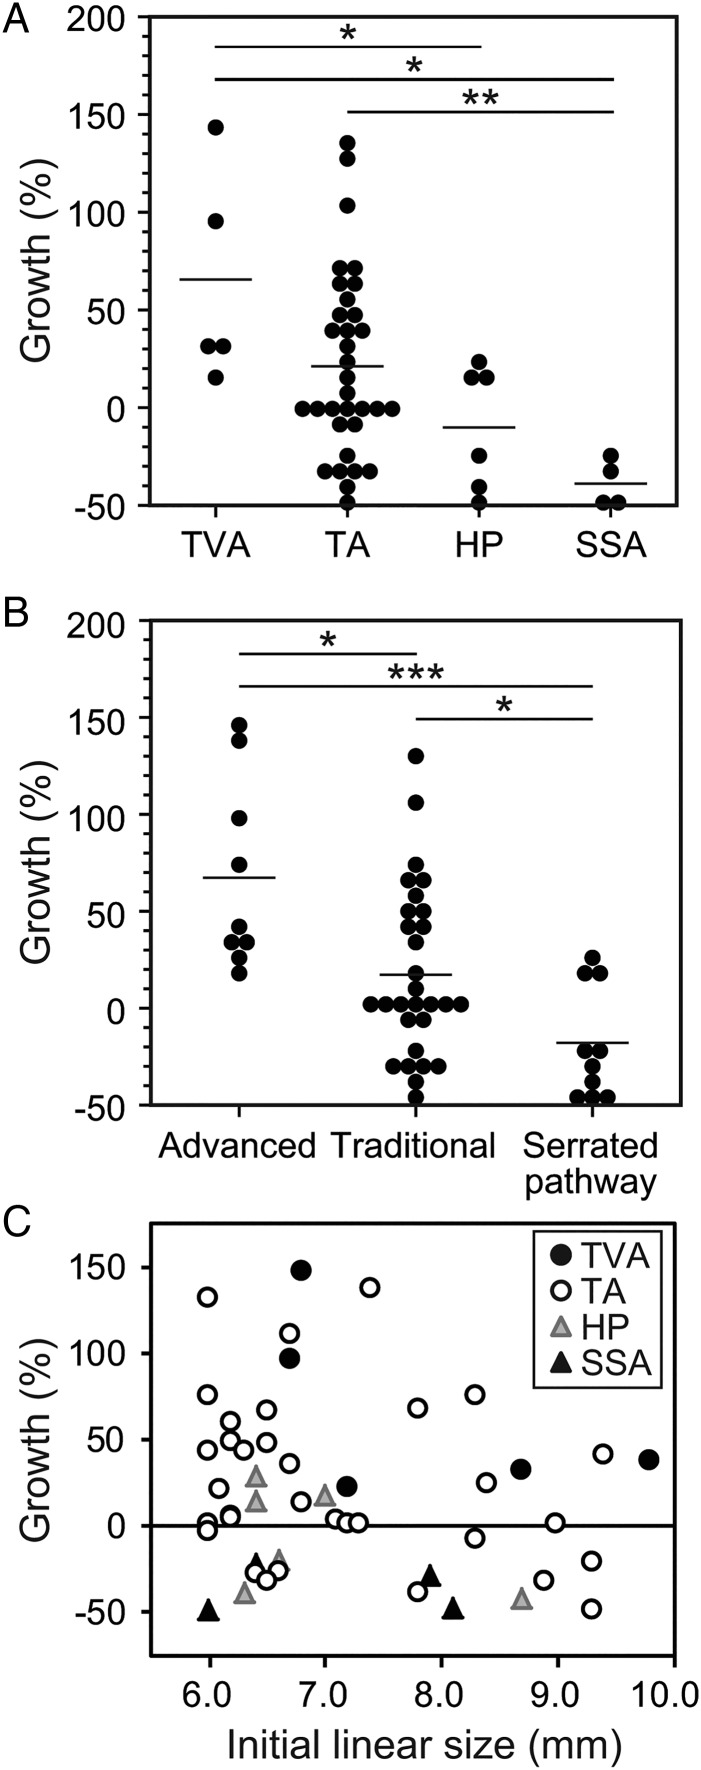
Figure 2.
Pathology correlates with per cent volumetric growth. (A) Per cent volumetric growth rates are shown for individual polyps classified as tubulovillous adenomas (TVAs), tubular adenomas (TAs), hyperplastic polyps (HPs) or sessile serrated adenomas (SSAs). Horizontal lines represent the means (p value=0.006, Kruskal-Wallis test). Pairwise comparisons based on the Wilcoxon rank-sum test are shown as *p≤0.05, **p≤0.01, ***p≤0.001. (B) Per cent volumetric growth rates for individual polyps are classified as advanced adenomas (≥10 mm in linear size, villous component or high-grade dysplasia), traditional adenomas or serrated pathway polyps (HPs and SSAs) are shown. Horizontal lines represent the mean (p value=0.0008, Kruskal-Wallis test) with pairwise p values as represented in (A). Advanced adenomas differ from traditional adenomas (p value=0.013, Wilcoxon rank-sum test). (C) Initial linear size is not correlated with per cent volumetric growth (R2=0.038, p value=0.265, Kendall's rank correlation). Note the 48 resected polyps shown here were selected from the original Pickhardt et al study.2

