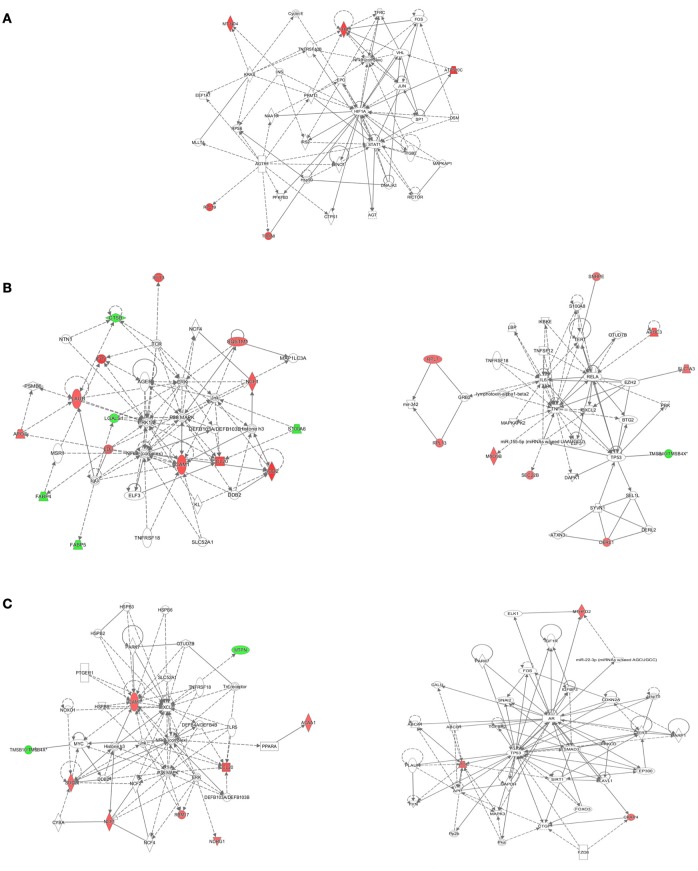
Figure 6.
The detailed view of the top-score networks. Red indicates significantly up-regulated proteins, and green indicates significantly down-regulated proteins. White indicates the proteins that were not identified in our data. The color depth reflects the fold-change of proteins. The shapes are indicative of the molecular class. Lines with arrows connecting between the molecules indicate molecular relationships. Solid lines indicate direct interactions, and dashed lines indicate indirect interactions. (A) The top-score IPA network of BCG infection: cellular development, cellular growth and proliferation, cell death and survival, (B) the top two IPA networks of H37Rv infection: cellular movement, hematological system development and function, and immune cell trafficking (left); cancer, cell death, and survival, and cellular movement (right), (C) the top two IPA networks of M. bovis infection: free radical scavenging, hereditary disorder, and immunological disease (left); cell death and survival, organismal injury and abnormalities, and tissue morphology (right). Additional networks are depicted in Table S4.

