Figure 1.

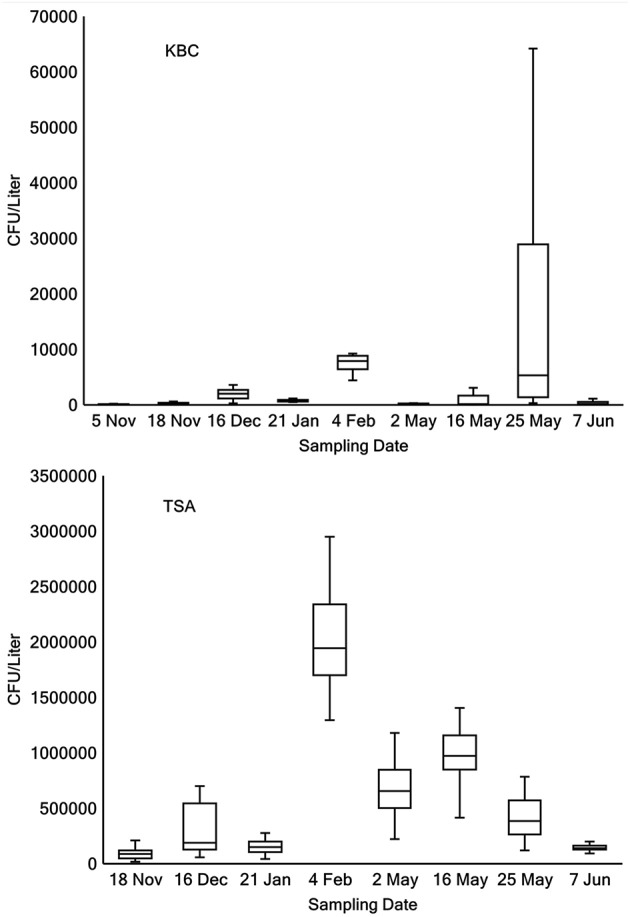
Box plots of concentrations (CFU Liter−1) of Pseudomonas grown on KBC (top panel) and bacteria grown on TSA (bottom panel) across all locations on each day of sampling.

Box plots of concentrations (CFU Liter−1) of Pseudomonas grown on KBC (top panel) and bacteria grown on TSA (bottom panel) across all locations on each day of sampling.