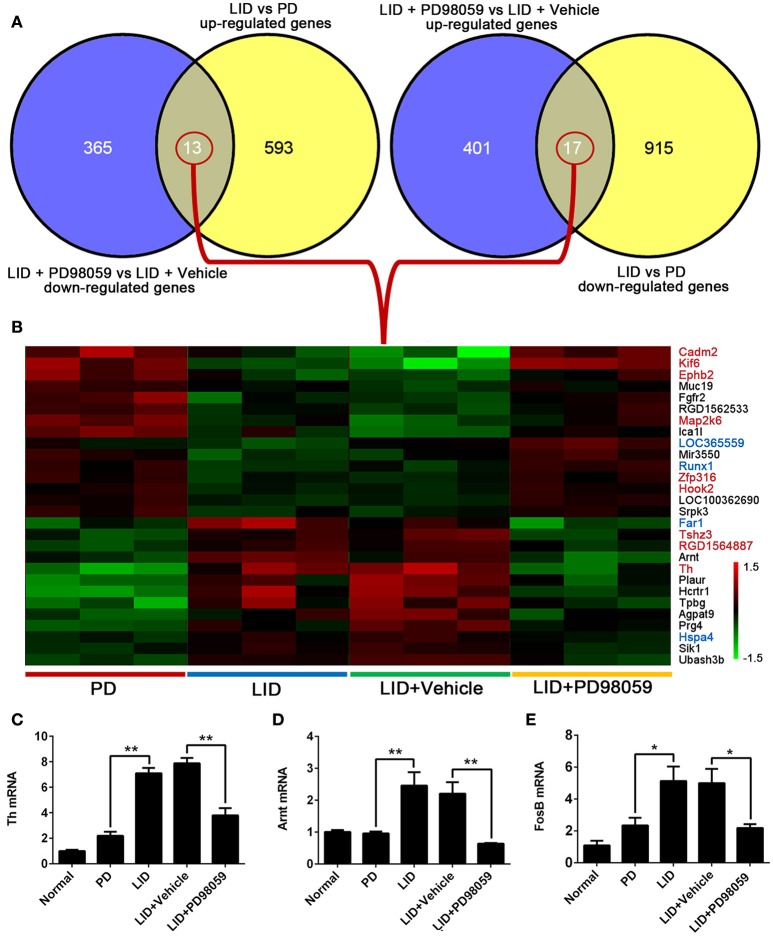
Figure 6.
Genes altered by L-DOPA treatment and responsive to PD98059 treatment. (A) The number of common genes in opposite trends between LID vs. PD and LID + PD98059 vs. LID + Vehicle (p < 0.05, Fold change ≥1.2 or ≤ 0.8333). (B) The common genes from the comparison presented in (A). The red and green colors in the heatmap represent up-regulation and down-regulation, respectively. The genes marked with red and blue font in the list represent common genes with red and steel blue module in this figure, respectively. (C–E) Changes in Th, Arnt, and FosB gene expression as detected by quantitative RT-PCR *p < 0.05, **p < 0.01 (one-way ANOVA followed by Tukey HSD and LSD post-hoc test, N = 3/group).

