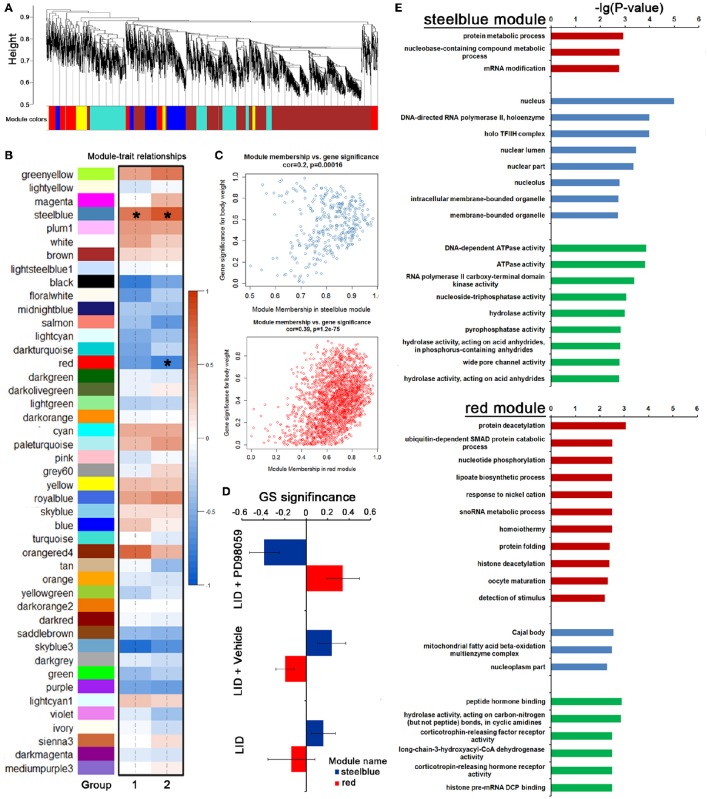
Figure 7.
PD98059-specific co-expression modules across LID+PD98059 group, LID + Vehicle group, and LID groups. (A,B) All candidates (including protein coding genes and lncRNA) in the dataset (37,177 transcripts in microarray) were hierarchically clustered under unsupervised average linkage and classified into 45 modules labeled by color. (C) The module membership (MM) vs. gene significance (GS) plots for steelblue and red module showed that MM and GS are highly correlated (GS P < 0.05). (D) The steelblue and red module contained candidates negatively and positively correlated to the PD98059 treatment, respectively. (E) GO enrichment analysis about transcripts in steel blue and red module (P < 0.05).

