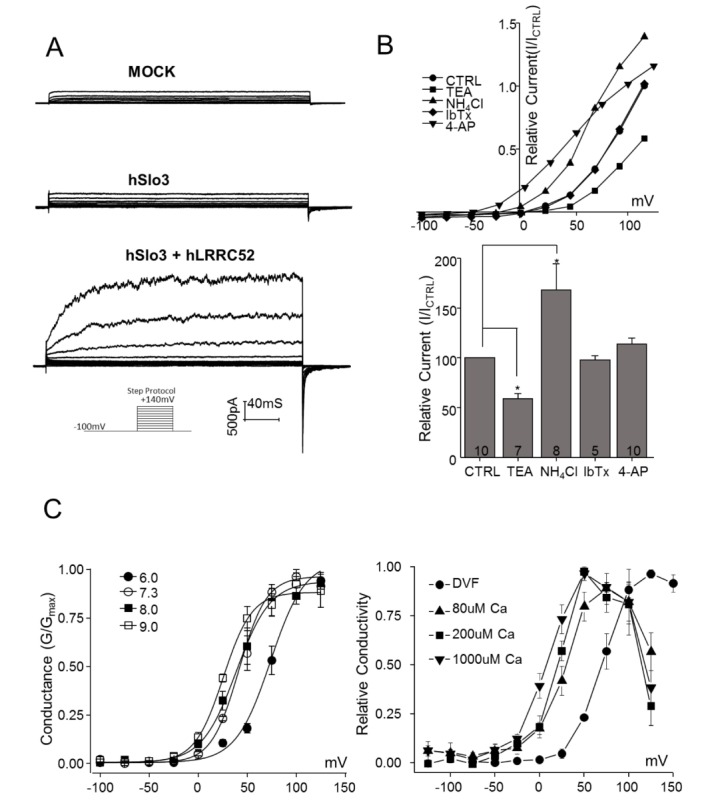
Fig. 1. Pharmacological characterization of hSlo3 currents.

(A) Representative traces of endogenous currents in HEK293 cells (upper panel; MOCK), currents in cells transfected only with the hLRRC52 subunit (middle panel; hLRRC52), and currents in cells co-transfected with hSlo3 and the hLRRC52 subunit (lower panel; hSlo3+hLRRC52). Currents were recorded using a step-depolarizing pulse from –100 to +140 mV, with a holding potential of –100 mV. (B) Upper panel: Pharmacological experiments designed to verify hSlo3 K+ currents, recorded as in (A) in the presence of TEA (20 mM), IbTx (100 nM), NH4Cl (10 mM), or 4-AP (25 mM). Lower panel: Inhibition was calculated as the percentage of current remaining after treatment relative to that prior to treatment at 116 mV. (C) G~V curves shifted towards the left with increasing alkalinization and internal Ca2+. Left panel: hSlo3 G~V curves, tested at various pHi values: pH 6.0 (●), pH 7.3 (○), pH 8.0 (□), pH 9.0 (□). Right panel: hSlo3 G~V curves, tested at various [Ca2+]i: DVF (●), 80 µM Ca (▲), 200 µM Ca (■), 1000 µM Ca (▼). Data are presented as averages of results from five patches. Lines are fits to the Boltzmann equation. Vh values for each Boltzmann component are indicated for each condition. The number of cells is indicated in a bar graph. *p<0.05.
