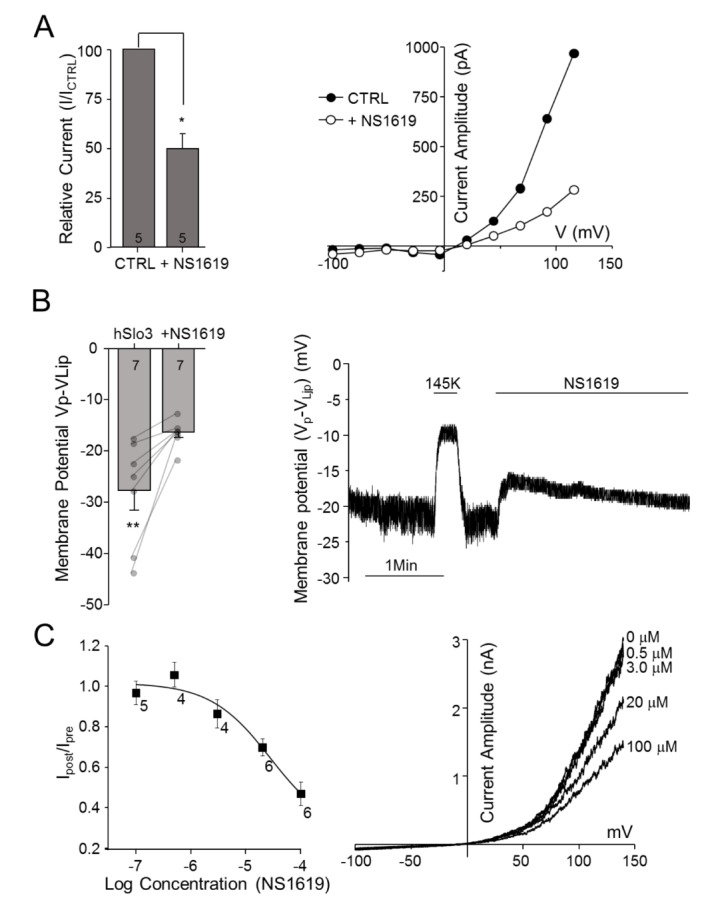
Fig. 2. Effects of the BKCa activator NS1619 on hSlo3 K+ currents.

(A) Left panel: Extracellular application of 50 µM NS1619 inhibits hSLo3+hLRRC52 currents. Inhibition was calculated as the percentage of current remaining after treatment relative to that prior to treatment at 116 mV. Right panel: Representative traces showing I~V relationships before (●) and after (○) treatment. (B) Inhibition of hSlo3+hLRRC52 current by 50 µM NS1619, determined by measuring changes in membrane potential before and after treatment. Left panel: NS1619-induced membrane potential depolarization. Right panel: Representative continuous trace showing changes in membrane potential during the application of 50 µM NS1619. (C) Left panel: Concentration-response curve for NS1619 inhibition of hSlo3+hLRRC52. Right panel: Representative I~V traces showing changes in current with the application of NS1619. The number of cells is indicated in a bar graph. *p<0.05, **p<0.01.
