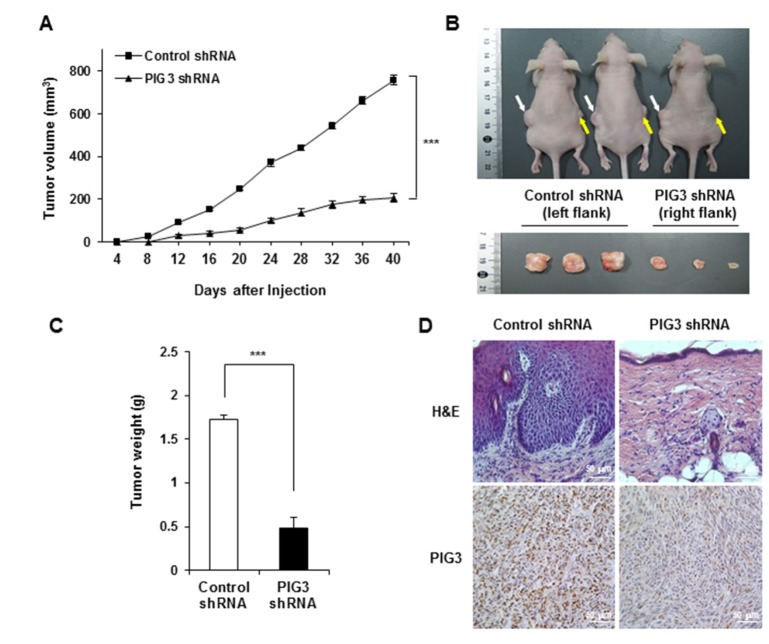
Fig. 4. Effects of PIG3 knockdown on tumor growth cells in a nude mice HCT116 xenograft model.
Control-(white arrows) and PIG3 shRNA (yellow arrows) HCT116 cells were injected subcutaneously into the left and right flank of nude mice, respectively (n= 3). (A) Tumor volumes were measured every 4 days over a period of 40 days. (B) The morphology of nude mice (upper panel) and xenograft tumors (lower panel) were photographed 40 days after injection. (C) The graph represents the average of the tumor weights. Values are means of tumor weights±S.D. from triplicate experiments. ***p<0.001, compared to control shRNA-transfected group. (D) Tumor tissues were subjected to H&E staining and immunostaining for determination of expression of PIG3 in the tumor xenografts.

