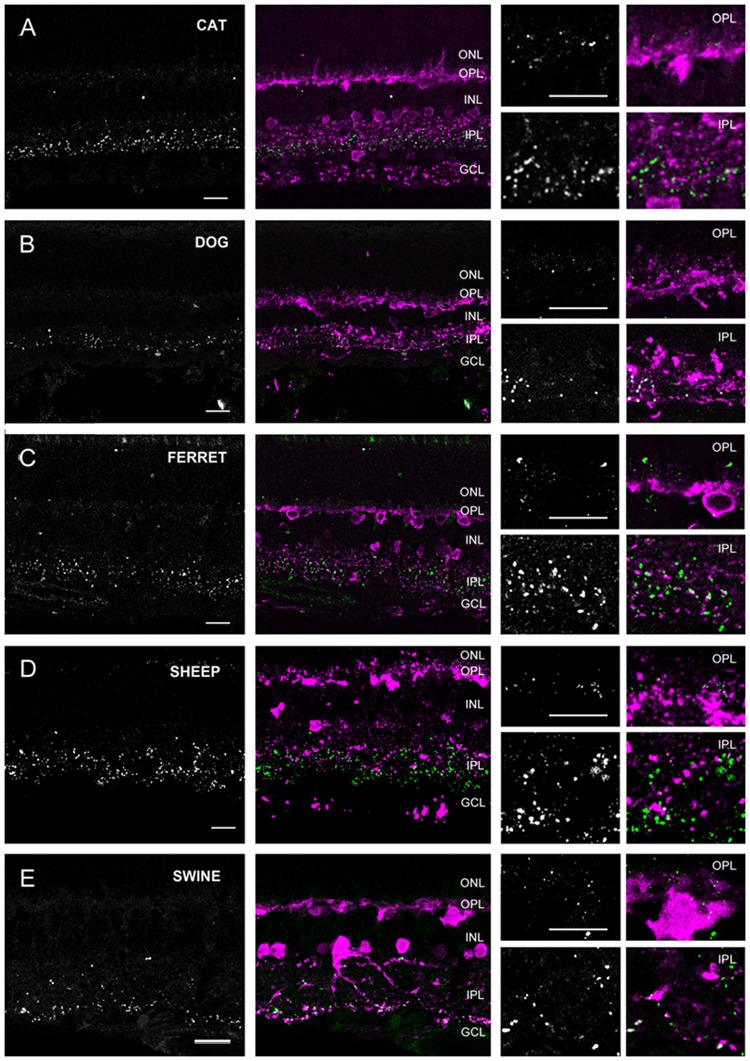
FIGURE 4.

Cx36 plaque expression in retinas of carnivore and artylodactile species. (A–E) Retinal cross-sections display Cx36 plaques in the cat (A), dog (B), ferret (C), sheep (D), and swine (E) retinas in the column to the left. Column in the middle display the same images with Cx36 plaques (green) and CaR immunopositive retinal neurons (magenta). CaR expressing cells included horizontal cells in the outer retina and ACs and sporadic GCs (not shown) in the inner retina. The CaR profiles demarcated boundaries of both the OPL and IPL thus allowing for the more precise examination of Cx36 plaque distribution patterns. Insets to the right display enlarged images of Cx36 (left) and Cx36/CaR (right) labeled samples focusing on areas either in the OPL (top) or in the IPL (bottom). ONL, outer nuclear layer; OPL, outer plexiform layer; INL, inner nuclear layer; IPL, inner plexiform layer; GCL, ganglion cells layer. Scale bars: 10 μm.
