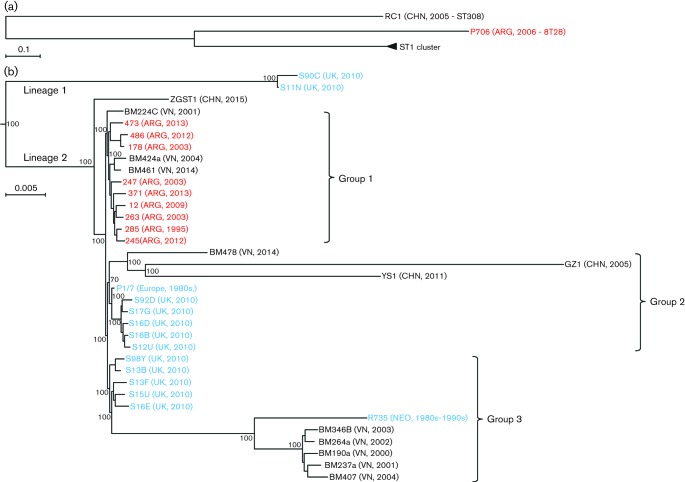
Fig. 1.
Phylogenetic relationship of ST1 strains. (a) Phylogenetic tree of all strains (including sequence type) used in this study. The ST1 cluster was compressed and is indicated by a triangle. (b) Phylogenetic tree of ST1 strains included in the present study compared with available data from GenBank. The numbers on the branches correspond to the bootstrap values. Strains from different areas are represented by different colors: Asia (black), Europe (blue) and Argentina (red). Geographical origins and year of isolation are included, in parentheses, after the strain name.

