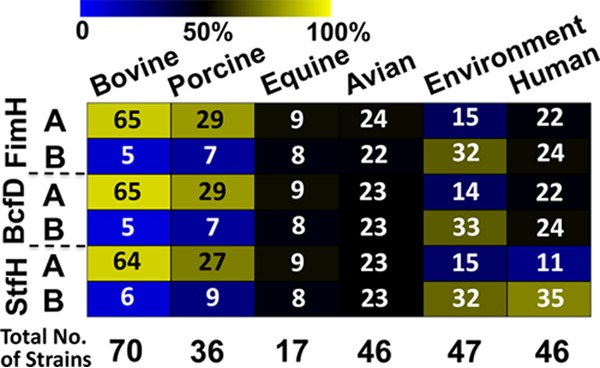
FIG 2.

Association of S. Newport strain sources with adhesin alleles. The percentages of S. Newport strains for which the source of isolation was associated with a specific adhesin allele (group A or B) are displayed as colors, based on a gradient from blue (0% association) to black (50% association) and yellow (100% association). The exact numbers of strains are indicated in each cell, and total numbers for each source of isolation are shown at the bottom of the heat map.
