
FIG 2 .
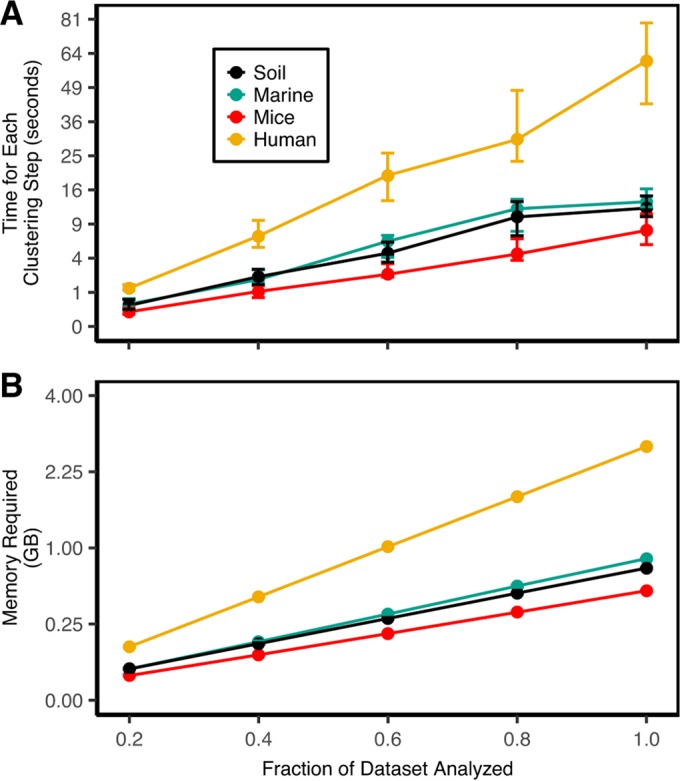
OptiClust performance. Average execution time (A) and memory usage (B) required to cluster the four natural data sets. The confidence intervals indicate the range between the minimum and maximum values. The y axis is scaled by the square root to demonstrate the relationship between the time and memory requirements relative to the number of unique sequences squared.