
Figure 3.
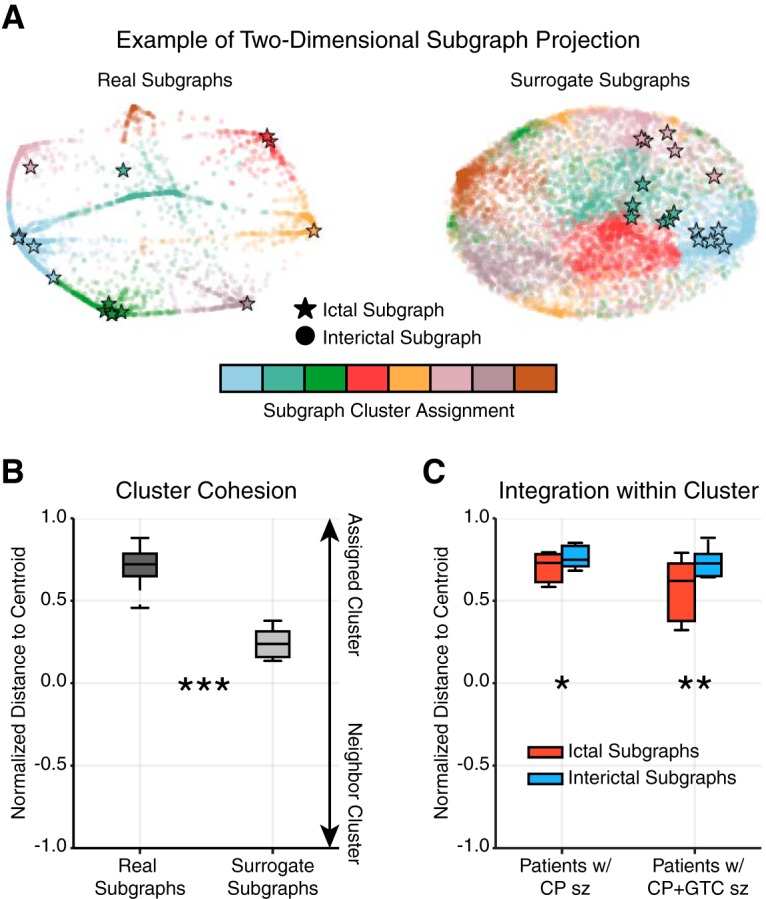
Ictal subgraphs are recapitulated during interictal epochs. A, Example two-dimensional projection of a patient’s subgraph coclustering probability matrix. Each marker represents a subgraph from a single epoch and the distance between a subgraph pair indicates their topological similarity (i.e., closer subgraphs are more similar); circles represent interictal subgraphs and bolded stars represent ictal subgraphs; colors represent cluster assignment based on consensus clustering of the subgraph ensemble. The projections of real subgraphs (left) of the same cluster (color) tend to be closer to one another than to subgraphs of other clusters. In contrast, the projections of surrogate subgraphs from the same cluster tend to be as close to one another as surrogate subgraphs from other clusters. B, Normalized, projected distance of a subgraph to its assigned cluster’s centroid, the mean geographical location of subgraphs in a cluster, relative to its neighboring cluster’s centroid (most proximal, nonassigned cluster centroid), averaged over all subgraphs of each patient (N = 22). Real subgraphs were significantly closer to their cluster centroid compared with surrogate subgraphs (paired $t$-test; t21 = 12.09, p < 7 × 10⁻¹¹), suggesting the same set of brain regions functionally interact repeatedly over several hours. C, Normalized, projected distance of ictal and interictal subgraphs to their cluster centroid, averaged over all ictal or interictal subgraphs of each patient with complex partial (CP) seizures (N = 8) and with secondarily generalized complex partial (CP + GTC) seizures (N = 10). Both groups of patients expressed ictal subgraphs that were significantly further away from their cluster centroid than interictal subgraphs (paired $t$-test; CP: t7 = −3.29, p = 0.013; CP + GTC: t9 = −4.26, p = 0.002), suggesting ictal subgraphs may represent functional connections that lie at the transition between interictal subgraphs. (*p < 0.05, **p < 0.01, ***p < 0.001; Bonferroni corrected for multiple comparisons).