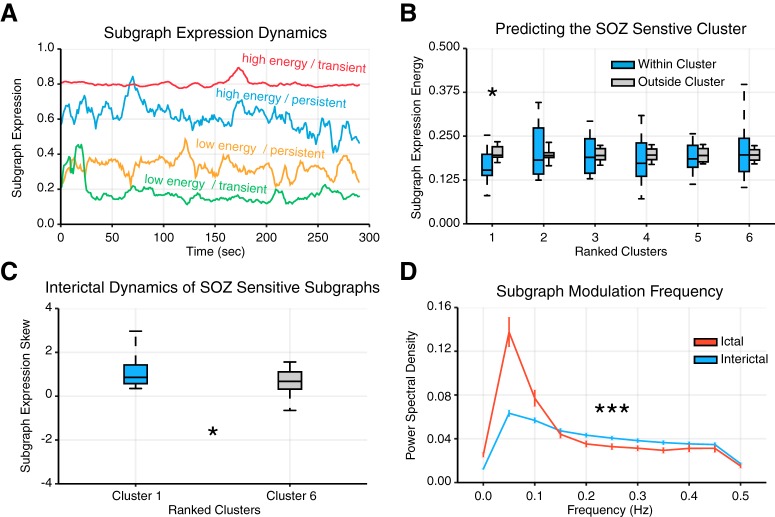
Figure 5.
Expression energy and transience differentiate ictal and interictal epochs. A, We computed (i) subgraph expression energy--the overall activity of a subgraph--and (ii) subgraph expression skew--the temporal transience or persistence of a subgraph’s activity. Shown here are four examples of subgraph expression from a single patient, chosen by identifying subgraphs whose expression energy and expression skew were in the bottom and top third of all epochs. These examples demonstrate high energy and transience (red), high energy and persistence (blue), low energy and persistence (yellow), and low energy and transience (green). B, Distribution of subgraph expression energy, averaged across interictal epochs of each cluster (ranked by SOZ sensitivity) for each patient (N = 22). For each cluster, we compared the distribution of expression energy for subgraphs of that cluster to expression energy for subgraphs of all other clusters and found significantly lower expression energy of subgraphs within cluster 1, most sensitive to nodes in the SOZ, than outside cluster 1 (paired $t$-test; t21 = −3.21, p = 0.004; Bonferroni corrected for multiple comparisons). C, Distribution of subgraph expression skew, averaged across interictal epochs of clusters 1 and 6 for each patient (N = 22). We observed subgraphs of cluster 1, which were most sensitive to nodes in the SOZ, exhibited significantly greater skew, and therefore greater temporal transience, than subgraphs of cluster 6, which were most sensitive to nodes outside the SOZ (paired t test; t21 = 2.12, p = 0.04). These findings suggest that subgraphs with strongly connected SOZ nodes exhibit more transient, burst-like, dynamics than subgraphs with strongly connected non-SOZ nodes. D, PSD distribution of ictal and interictal subgraph expression, averaged over patients (N = 22). We observed a significant difference between ictal and interictal subgraph expression, ictal subgraphs modulate their expression at lower frequencies and interictal subgraphs modulate their expression at higher frequencies (FDA; ). These findings suggest that subgraph expression is more gradual and coordinated during ictal epochs than interictal epochs.

