
Figure 6.
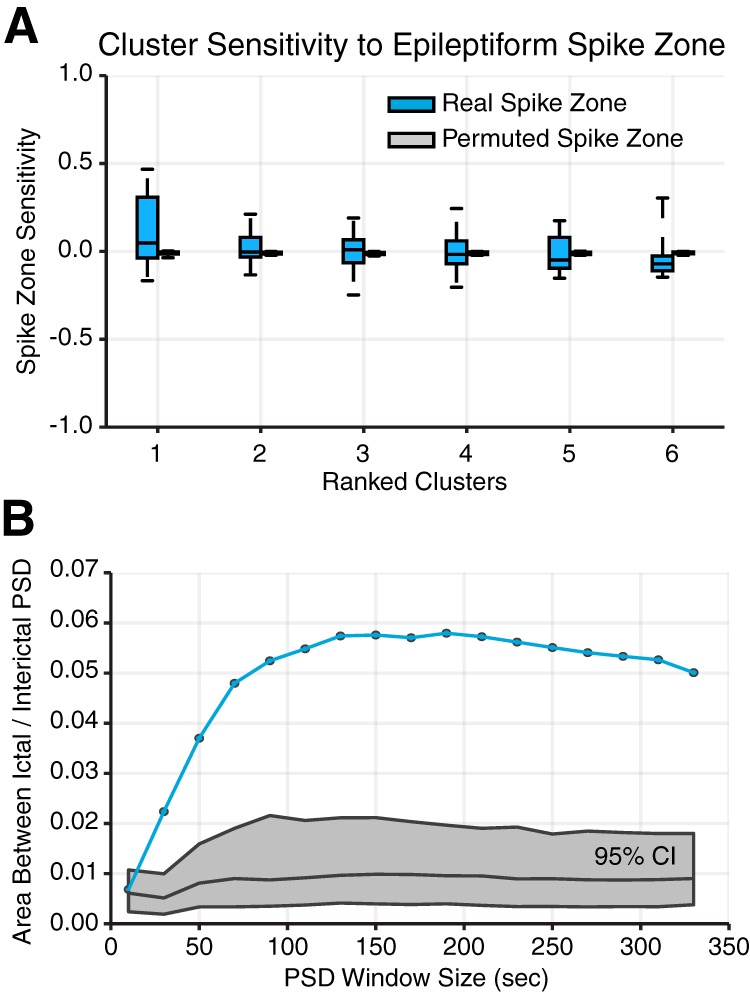
Methodological considerations. A, Distribution of average spike sensitivity of subgraphs in each cluster, from each patient (N = 22). Spike sensitivity of true spiking regions in blue and of permuted spiking regions in gray. We observed no significant effect of subgraph cluster assignment on interictal spike sensitivity (one-way ANOVA; F5 = 1.50, p = 0.20). We also found no significant differences between spike sensitivity for real spiking regions compared with permuted spiking regions (paired $t$-test; t21 < 2.2, p > 0.05; Bonferonni corrected for multiple comparisons). These results demonstrate that functional connectivity described by subgraphs is not sensitive to network regions that exhibit interictal spikes. B, Mean area between PSD curves for ictal and interictal subgraphs for different window sizes used in the calculation of the PSD. True area in blue and 95% confidence interval using FDA in gray. These results demonstrate that our finding of differences in subgraph expression dynamics during ictal and interictal epochs is robust to choice in window size used to compute the PSD.