
Fig. 2.
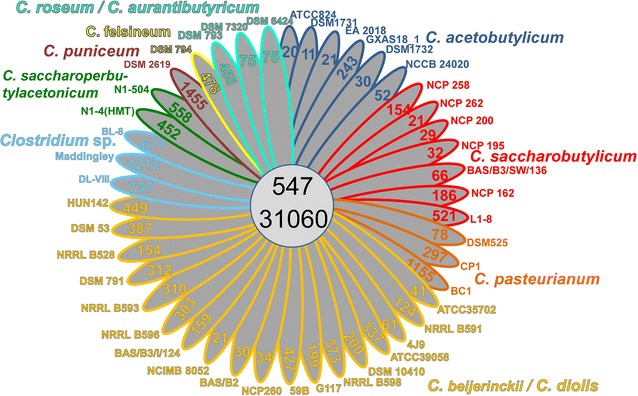
Core/Pan genome analysis of 44 clostridial genomes: a simplified Venn diagram showing the core and the pan genome of all 44 solventogenic clostridia. The number of genome-specific OGs is depicted in the respective ellipse. Ortholog detection was done with blastp and the Proteinortho software [8] with a similarity cutoff of 50% and an E value of 1e−10