Fig. 6.

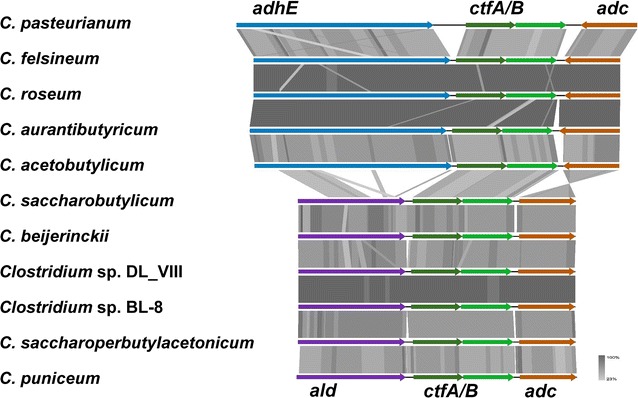
Structure of the sol operon: structure of the sol operon based on Tblastx comparison of representative members of the different subclades. An E value cutoff of 1e−10 was used and visualization were done with the program Easyfig [21]

Structure of the sol operon: structure of the sol operon based on Tblastx comparison of representative members of the different subclades. An E value cutoff of 1e−10 was used and visualization were done with the program Easyfig [21]