
Fig. 3.
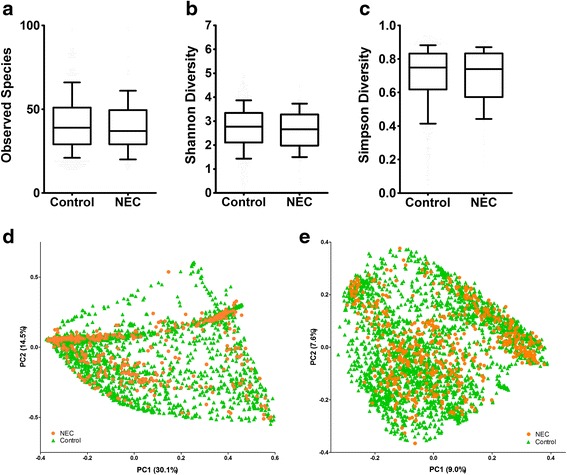
Alpha and beta diversity-NEC vs. controls. Alpha-diversity comparison for all corrected gestational ages (CGA) by NEC case vs. control by three metrics. a Observed species, b Shannon diversity, and c Simpson diversity, none of the comparisons are significantly different. Data is represented in box and whisker plots with median and whiskers representing 10–90th centiles. Principal co-ordinate (PCoA) plots of weighted UniFrac distance (d) and unweighted UniFrac distance (e) including all time points from all studies shows a lack of clustering between cases and controls. The figure in parenthesis next the axis labels represents the proportion of variation explained along each axis. Orange circles represent samples from preterm infants with NEC, and green triangles represent samples from control preterm infants