
Fig. 6.
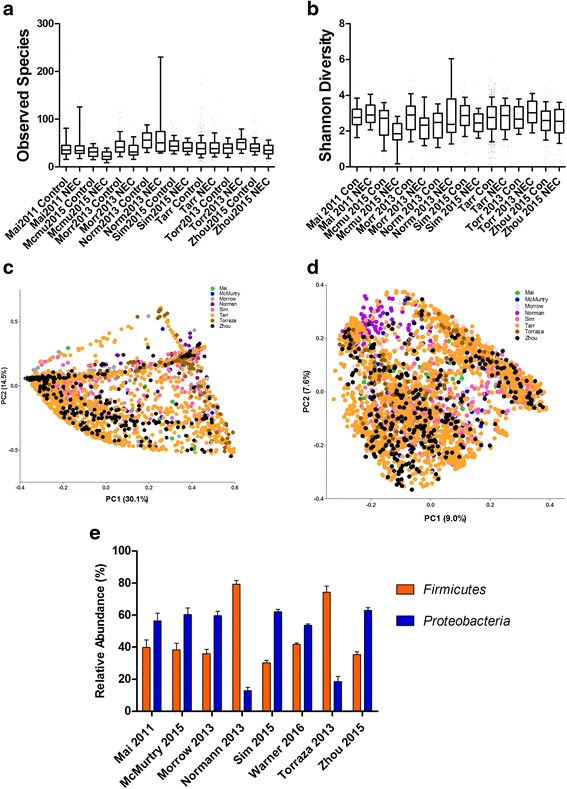
Heterogeneity assessment by study. Observed species (operational taxonomic unit, OTU) richness (a) and Shannon diversity index (SDI) values (b) in cases and controls are subgrouped by study. Data is represented in box and whisker plots with median and whiskers representing 10–90th centiles. c, d Depict weighted and unweighted UniFrac distances in PCoA plots of NEC and controls subgrouped by study, and no notable clustering was observed. The proportion of variation explained along each axis is listed in parenthesis with the axis labels. e Represents differences in proportion of sequences based on study. Studies by Normann [34] and Torraza [56] showed significant increase in proportion of sequences of Firmicutes and significant decrease in proportion of sequences of Proteobacteria compared to other studies (*p < 0.05)