
Fig. 3.
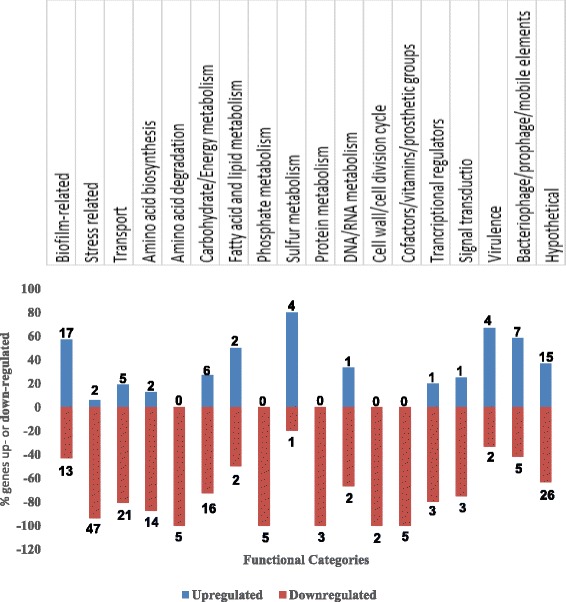
Graphic representation of differentially expressed genes in functional groups. Upregulated (blue bars) and downregulated genes (red bars) are shown as the percentage of total genes differentially expressed in each functional category. Only those genes that were expressed at ≥ 2.0-fold (p < 0.05) are used in this graphic display. The functional categories were selected from the RAST Server [44]