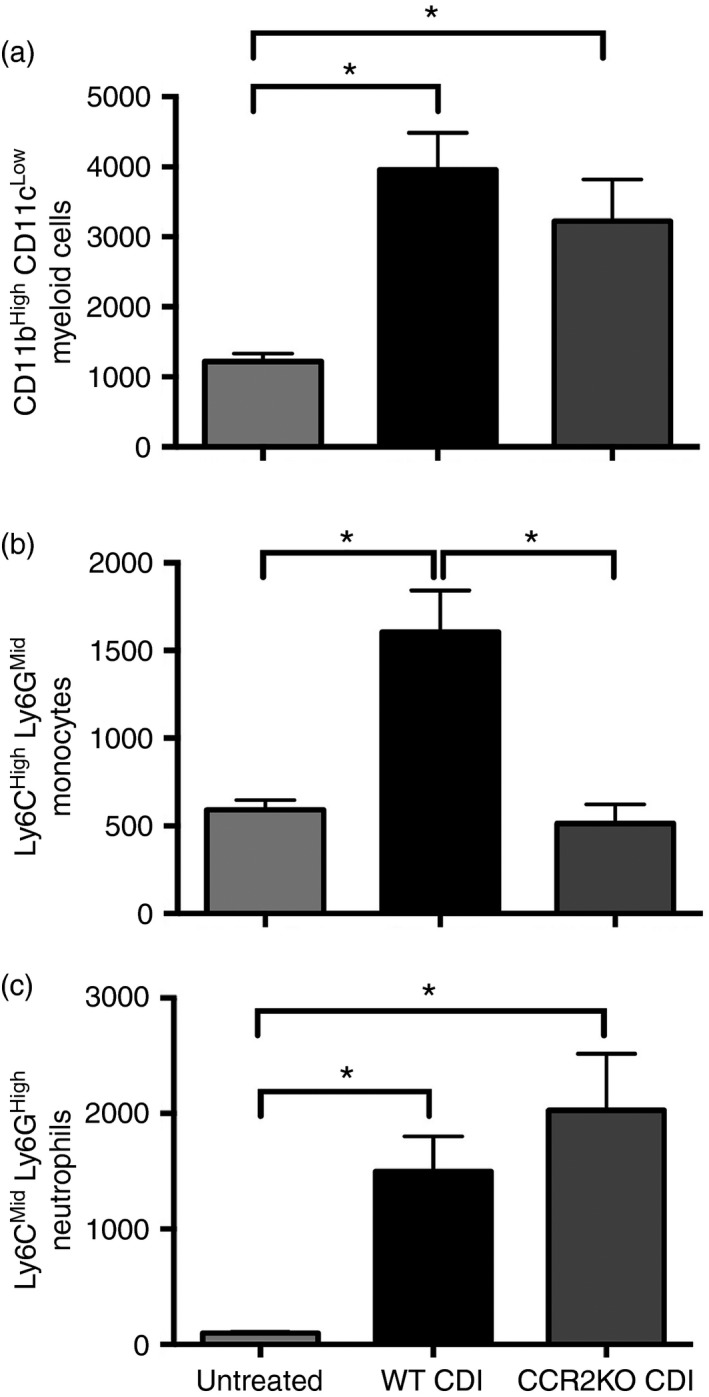
Figure 3.

Quantification of colonic myeloid cell populations from Untreated, wild‐type Clostridium difficile‐infected (WT CDI), and CCR2 knockout (KO) CDI mice as defined in Fig. 2. (a) Number of CD11bHigh CD11cLow, (b) Ly6CH igh Ly6GM id and (c) Ly6CM id Ly6GH igh cells per 100 000 cells. All populations were defined as shown in Fig. 2. Bars represent mean ± SEM number of the indicated cell type per 100 000 cells. n ≥ 6 per group. CDI = C. difficile‐infected. *P < 0·05 for the differences between the indicated groups.
