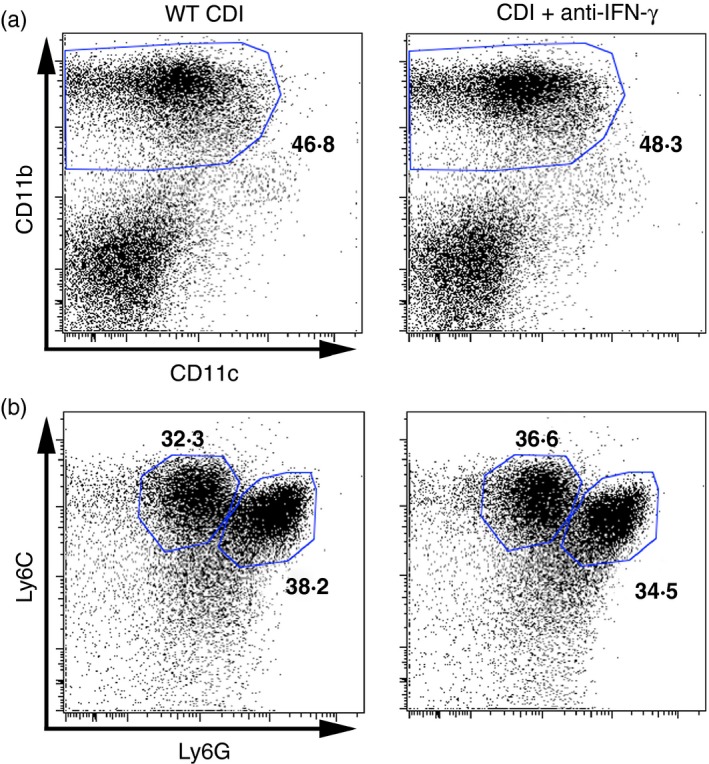
Figure 5.

Flow cytometric analysis of colonic CD45+ leucocytes from wild‐type Clostridium difficile‐infected (WT CDI), and CDI+ anti‐interferon‐γ (IFN‐γ) ‐treated mice. (a) Analysis of CD11b and CD11c expression profiles on isolated colonic CD45+ leucocytes. (b) Analysis of Ly6C and Ly6G expression profiles on the CD11bHigh CD11cLow population as defined in (a). The number in bold indicates the percentage of the parent population contained within the indicated gate. [Colour figure can be viewed at wileyonlinelibrary.com]
