Figure 2.

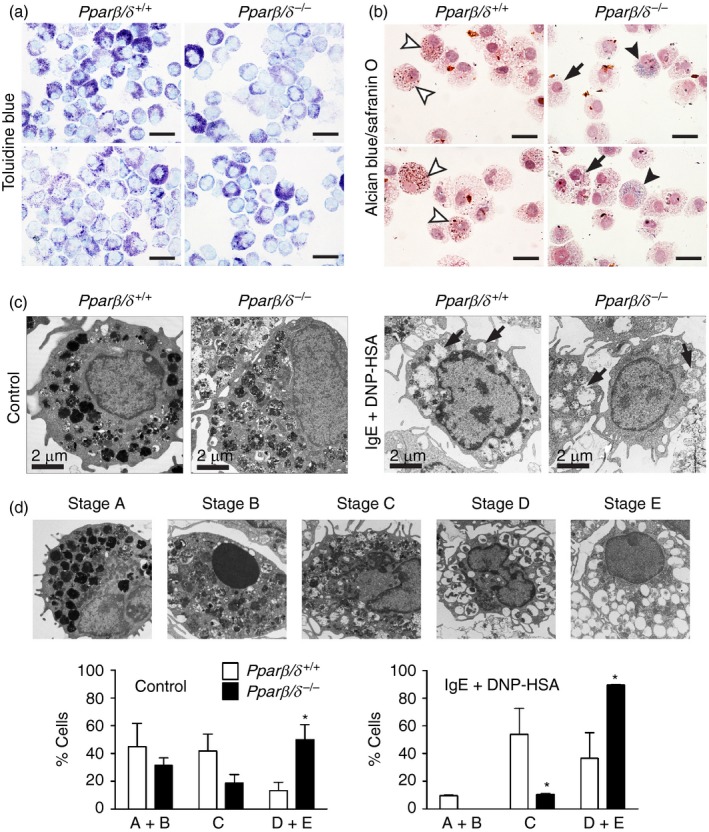
Peroxisome proliferator‐activated receptor‐β/δ (PPAR β/δ) regulates maturation and granule formation of bone‐marrow‐derived mast cells (BMMCs). BMMCs were isolated from adult female Pparβ/δ +/+ and Pparβ/δ −/− mice, and cultured in media containing interleukin‐3 (IL‐3) for 4 weeks followed by co‐stimulation with IL‐3 and stem cell factor (SCF) for 2 weeks. (a) Representative photomicrographs of cytospun BMMCs from adult Pparβ/δ +/+ and Pparβ/δ −/− mice, showing a denser granules distribution in BMMCs from Pparβ/δ +/+ mice by toluidine blue staining. (b) Representative photomicrographs of cytospun BMMCs from adult Pparβ/δ +/+ and Pparβ/δ −/− mice, illustrating a heterogeneous distribution of granules in BMMCs by Alcian blue/safranin O double staining. BMMCs from Pparβ/δ +/+ mice exhibited higher content of red granules (white arrowheads), consistent with a mature phenotype. However, BMMCs from Pparβ/δ −/− mice showed a higher content of blue granules (black arrowheads) or mild to moderate level of blue granules (black arrow), consistent with a less mature phenotype. Magnification × 100. Bar = 50 μm. (c) Representative photomicrographs of BMMCs from adult Pparβ/δ +/+ and Pparβ/δ −/− mice as assessed by transmission electron microscopy. BMMCs from Pparβ/δ +/+ mice exhibited darker and denser granules than BMMCs from Pparβ/δ −/− mice. BMMCs were also sensitized by IgE/DNP‐HSA activation to initiate degranulation, represented as empty granules (arrows). Magnification = 4000×. Bar = 2 μm. (d) Upper panel: Representative photomicrographs of BMMCs showing the five different stages of mast cell maturation as defined by others.16 Lower panels: The average percentages of each classification is shown for each genotype in resting and IgE/DNP‐HSA treated mast cells. For Pparβ/δ +/+ control mast cells, the absolute number of cells in stages A+B, C, and D+E were 15·7 ± 5·9, 14·6 ± 4·2 and 4·7 ± 2·1. For Pparβ/δ +/+ mast cells stimulated with IgE/dinitrophenyl‐human serum albumin (DNP‐HSA), the absolute number of cells in stages A+B, C, and D+E were 3·3 ± 0·2, 18·9 ± 6·6 and 12·8 ± 6·4. For Pparβ/δ −/− control mast cells, the absolute numbers of cells in stages A+B, C and D+E were 11·0 ± 1·9, 6·5 ± 2·2 and 17·5 ± 3·8. For Pparβ/δ −/− mast cells stimulated with IgE/DNP‐HSA, the absolute numbers of cells in stages A+B, C and D+E were 0·0 ± 0·0, 3·7 ± 0·2 and 31·3 ± 0·2. These values are consistent with the range in BMMCs examined per genotype and treatment from a total of five mice per treatment group (control and stimulated; 30–40 BMMCs). Values represent the mean ± SEM. *Significantly different than Pparβ/δ +/+, P ≤ 0·05. [Colour figure can be viewed at wileyonlinelibrary. com]
