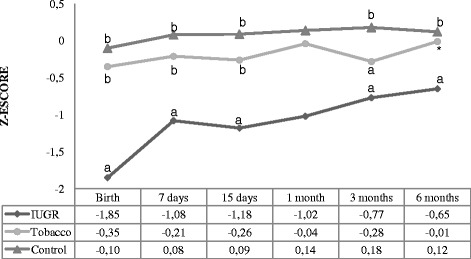
Fig. 4.

Head circumference-for-age z-score. Analysis performed using the generalized estimated equation (GEE) model. - Comparison between the groups (P < 0.001), comparison between times (P < 0.001), and comparison between group and times (interaction: P < 0.001). - We used letters a, b, and c to express the differences between the three groups. Means followed by the same letter showed no statistically significant difference (P > 0.05) based on the GEE analysis, followed by the Bonferroni multiple comparison test. *There was no statistically significant difference between the tobacco group and the other groups
