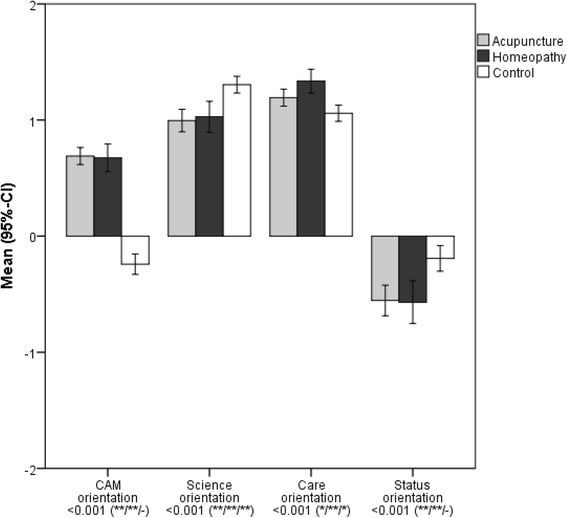
Fig. 1.

Means (95% confidence intervals) for the four main factors CAM orientation, science orientation, care orientation and status orientation. Higher values indicated stronger agreement. p-values for three-group comparisons from ANOVA (significance levels for pairwise comparisons from Student t-tests: − p ≥ 0.05; * p =0.002 to p =0.049; ** p ≤ 0.001; order: first position - acupuncture vs. control, second position - homeopathy vs. control; third position - acupuncture vs. homeopathy)
