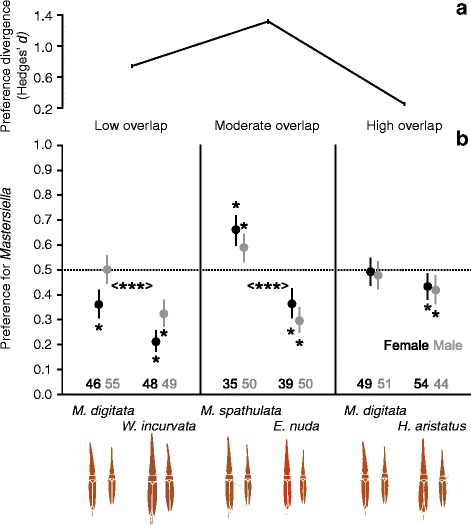
Fig. 4.

Divergence in host preference. Host preference differences were detected in the low overlap and moderate overlap comparisons, but divergent preference was strongest in the moderate overlap comparison (higher Hedges’ d means (variance also shown) indicate stronger host preference divergence in panel a). In panel b significance in host preference divergence is indicated with < ***>, P < 0.001. Names on the x axes correspond to the host-plants insects were collected from. The y axes represent the probability that Mastersiella (M. digitata or M. spathulata) was chosen over the other species, estimated by means of binomial GEEs. GEE estimated means and 95% CI of females (black) and males (grey) are shown. When bars are above 0.5 it indicates a preference for Mastersiella, when below it indicates a preference for the other species (indicated by *). Sample sizes are shown below each mean and 95% CI
