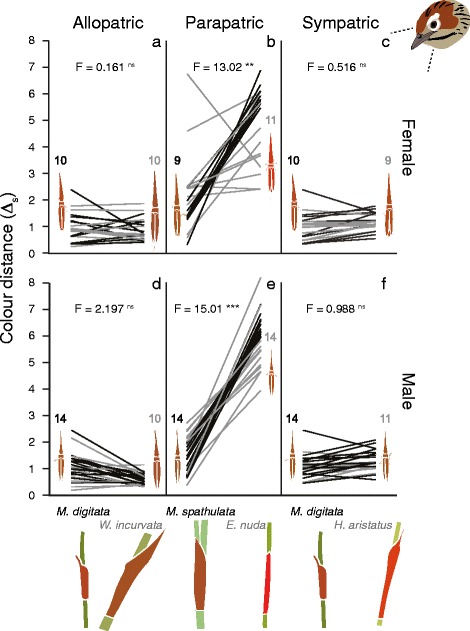
Fig. 6.

Colour divergence. We detected local adaptation in leaf sheath matching in bird vision in the moderate overlap (b and e) comparison, but not in the high overlap and (a and d) and low overlap comparisons (c and f). Restio species are shown on x axes and the degree of colour matching (ΔS in JNDs) between restio sheaths and insects (in bird vision) are shown on the y axes. A lower ΔS is indicative of a closer match between an insect and a leaf sheath (0 would be a perfect match). Each line connects two measurements on an individual insect. Black lines indicate populations associated with host-plants on the left of each panel (always Mastersiella spp.) and those that are grey represent populations associated with species on the right (W. incurvata, E. nuda or H. aristatus). Interaction effects from repeated measures ANOVAs are shown on each graph. Strong interaction effects are indicative of local adaptation (*** indicates P < 0.001, ** P < 0.01, and ns P > 0.05). Sample sizes associated with each population are shown above leafhopper cartoons. Restio sheath colour and ecotype colour of cartoons were obtained by spectrophotometer and converted to median RGB values for visualisation in human vision
