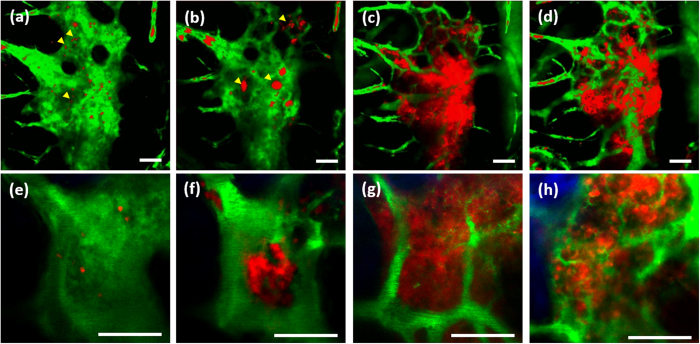
Figure 3. Longitudinal TP images of the same BM cavity post BMT.
(a–d) MIP TP images in a large FOV on days 1, 4, 9, and 20 post BMT, respectively (Supplementary Videos 4,5,6,7). (e–h) Single-plane TP images in a small FOV 110 μm below the bone surface on days 1, 4, 9, and 20 post BMT, respectively (Supplementary Videos 8,9,10,11). Blue: bone (SHG signal); red: transplanted BM cells (DsRed signal); green: vasculature (FITC-dextran signal). Scale bar: 100 μm.

