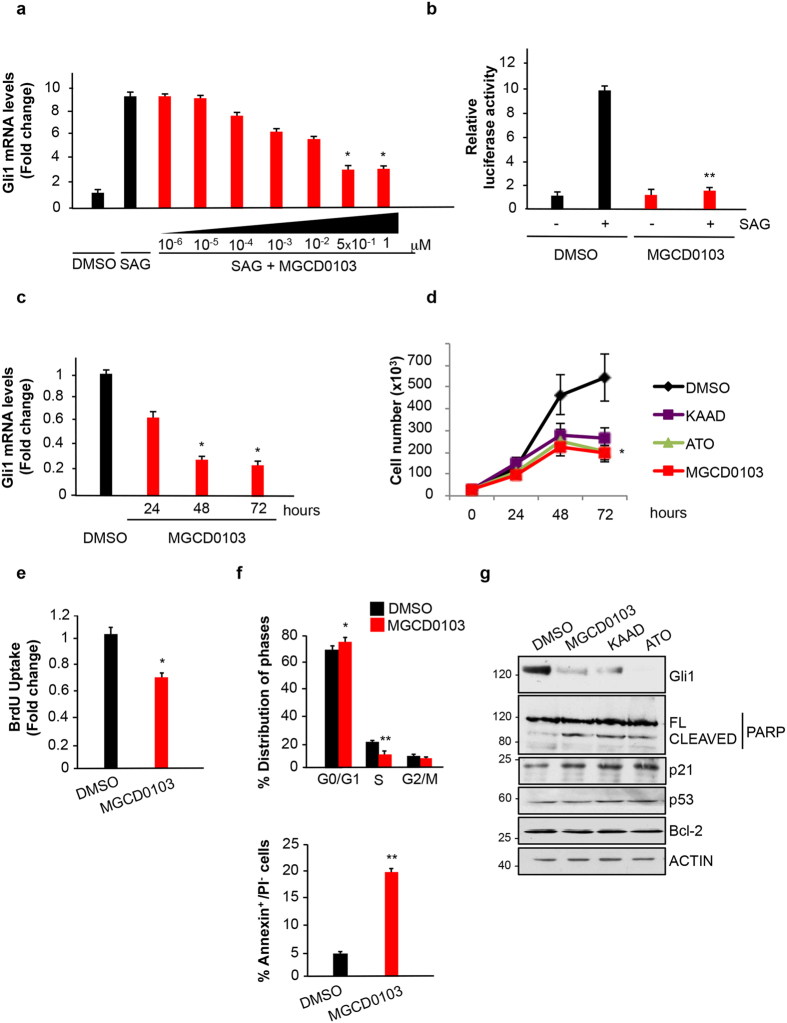
Figure 2. HDAC1 and HDAC2 pharmacological inhibition suppresses Hedgehog function.
(a) MEF cells were treated with SAG and increasing concentrations of MGCD0103 for 24 hours as indicated and Gli1 mRNA levels were analyzed by QPCR. DMSO, untreated control. Experiments were performed in triplicates. n = 3 (b) Luciferase assay in Shh-Light II cells treated with SAG and/or MGCD0103 for 24 hours. DMSO, untreated control. The experiments were performed in triplicates. n = 3 (c) MEF Ptch1−/− were treated with MGCD0103 or DMSO as a control for 24, 48 or 72 hours. Gli1 mRNA levels were analyzed by QPCR, experiments were performed in triplicates. n = 3 (d) Growth curve of Med1-MB cells treated with 1M Kaad-cyclopamine, 5 μM ATO, 0.5 μM MGCD0103 or DMSO for the indicated times. Each experimental point was performed in triplicate. n = 4 (e) BrdU incorporation assay in Med1-MB cells treated for 24 hours with 0.5 μM MGCD0103 or DMSO. (f) Cell cycle profile of Med1-MB cells treated for 24 h with 0.5 μM MGCD0103 or DMSO (Top). Flow cytometry analysis of Med1-MB cells double stained with annexin V/propidium iodide after treatment with 0.5 μM MGCD0103 or DMSO for 48 h (bottom). n = 3 (g) Western blot analysis in Med1-MB cells after 48 hours of treatment with 1 μM Kaad-cyclopamine, 0.5 μM MGCD0103, 5 μM ATO or DMSO as a control. Protein levels of Gli1, cleaved/full length (FL) PARP, p21, p53, Bcl-2 and actin are shown. *p < 0.05; **p < 0.01. Uncropped Western blot gels related to this figure are displayed in Suppl. Fig. 5.

